Endocrine and physiological changes in response to chronic corticosterone: a potential model of the metabolic syndrome in mouse
- PMID: 20211972
- PMCID: PMC2869265
- DOI: 10.1210/en.2009-1436
Endocrine and physiological changes in response to chronic corticosterone: a potential model of the metabolic syndrome in mouse
Abstract
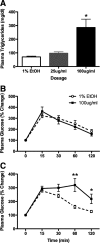
Numerous clinical and experimental studies have linked stress to changes in risk factors associated with the development of physiological syndromes, including metabolic disorders. How different mediators of the stress response, such as corticosterone (CORT), influence these changes in risk remains unclear. Although CORT has beneficial short-term effects, long-term CORT exposure can result in damage to the physiological systems it protects acutely. Disruption of this important physiologic signal is observed in numerous disparate disorders, ranging from depression to Cushing's syndrome. Thus, understanding the effects of chronic high CORT on metabolism and physiology is of key importance. We explored the effects of 4-wk exposure to CORT dissolved in the drinking water on the physiology and behavior of male mice. We used this approach as a noninvasive way of altering plasma CORT levels while retaining some integrity in the diurnal rhythm present in normal animals. This approach has advantages over methods involving constant CORT pellets, CORT injections, or adrenalectomy. We found that high doses of CORT (100 microg/ml) result in rapid and dramatic increases in weight gain, increased adiposity, elevated plasma leptin, insulin and triglyceride levels, hyperphagia, and decreased home-cage locomotion. A lower dose of CORT (25 microg/ml) resulted in an intermediate phenotype in some of these measures but had no effect on others. We propose that the physiological changes observed in the high-CORT animals approximate changes observed in individuals suffering from the metabolic syndrome, and that they potentially serve as a model for hypercortisolemia and stress-related obesity.
Figures


Similar articles
-
Chronic glucocorticoid exposure-induced epididymal adiposity is associated with mitochondrial dysfunction in white adipose tissue of male C57BL/6J mice.PLoS One. 2014 Nov 12;9(11):e112628. doi: 10.1371/journal.pone.0112628. eCollection 2014. PLoS One. 2014. PMID: 25389775 Free PMC article.
-
Chronic hypercortisolism causes more persistent visceral adiposity than HFD-induced obesity.J Endocrinol. 2019 Aug;242(2):65-77. doi: 10.1530/JOE-19-0168. J Endocrinol. 2019. PMID: 31117053
-
Lipid deposition in rats centrally infused with leptin in the presence or absence of corticosterone.Am J Physiol Endocrinol Metab. 2001 Oct;281(4):E809-16. doi: 10.1152/ajpendo.2001.281.4.E809. Am J Physiol Endocrinol Metab. 2001. PMID: 11551859
-
Chronic high corticosterone with voluntary corn oil ingestion induces significant body weight gain in mice.Physiol Behav. 2019 May 15;204:112-120. doi: 10.1016/j.physbeh.2019.01.004. Epub 2019 Jan 10. Physiol Behav. 2019. PMID: 30633898
-
Obesity and chronic stress are able to desynchronize the temporal pattern of serum levels of leptin and triglycerides.Peptides. 2014 Jan;51:46-53. doi: 10.1016/j.peptides.2013.10.024. Epub 2013 Nov 1. Peptides. 2014. PMID: 24184591
Cited by
-
Stress and human health in diabetes: A report from the 19th Chicago Biomedical Consortium symposium.J Clin Transl Sci. 2023 Nov 20;7(1):e263. doi: 10.1017/cts.2023.646. eCollection 2023. J Clin Transl Sci. 2023. PMID: 38229904 Free PMC article.
-
Cushingoid lipodystrophy can be prevented by thiazolidinediones.Endocrine. 2012 Dec;42(3):746-8. doi: 10.1007/s12020-012-9742-8. Epub 2012 Jul 17. Endocrine. 2012. PMID: 22801989 No abstract available.
-
Corticosterone induces discrete epigenetic signatures in the dorsal and ventral hippocampus that depend upon sex and genotype: focus on methylated Nr3c1 gene.Transl Psychiatry. 2022 Mar 16;12(1):109. doi: 10.1038/s41398-022-01864-7. Transl Psychiatry. 2022. PMID: 35296634 Free PMC article.
-
Corticosterone induces obesity partly via promoting intestinal cell proliferation and survival.Front Endocrinol (Lausanne). 2023 Jan 9;13:1052487. doi: 10.3389/fendo.2022.1052487. eCollection 2022. Front Endocrinol (Lausanne). 2023. PMID: 36699046 Free PMC article.
-
Chronic Corticosterone Exposure Suppresses Copper Transport through GR-Mediated Intestinal CTR1 Pathway in Mice.Biology (Basel). 2023 Jan 28;12(2):197. doi: 10.3390/biology12020197. Biology (Basel). 2023. PMID: 36829476 Free PMC article.
References
-
- Nieuwenhuizen AG, Rutters F 2008 The hypothalamic-pituitary-adrenal-axis in the regulation of energy balance. Physiol Behav 94:169–177 - PubMed
-
- Hill MN, Carrier EJ, Ho WS, Shi L, Patel S, Gorzalka BB, Hillard CJ 2008 Prolonged glucocorticoid treatment decreases cannabinoid CB1 receptor density in the hippocampus. Hippocampus 18:221–226 - PubMed
-
- Lussier AL, Caruncho HJ, Kalynchuk LE 2009 Repeated exposure to corticosterone, but not restraint, decreases the number of reelin-positive cells in the adult rat hippocampus. Neurosci Lett 460:170–174 - PubMed
-
- Magariños AM, McEwen BS 1995 Stress-induced atrophy of apical dendrites of hippocampal CA3c neurons: involvement of glucocorticoid secretion and excitatory amino acid receptors. Neuroscience 69:89–98 - PubMed
Publication types
MeSH terms
Substances
Grants and funding
LinkOut - more resources
Full Text Sources
Other Literature Sources

