. 2010 May 1;588(Pt 9):1635-45.
doi: 10.1113/jphysiol.2009.185322. Epub 2010 Mar 8.

Female mice target deleted for the neuromedin B receptor have partial resistance to diet-induced obesity

Affiliations

Female mice target deleted for the neuromedin B receptor have partial resistance to diet-induced obesity

Gabriela Silva Monteiro Paula et al. J Physiol. .

Abstract

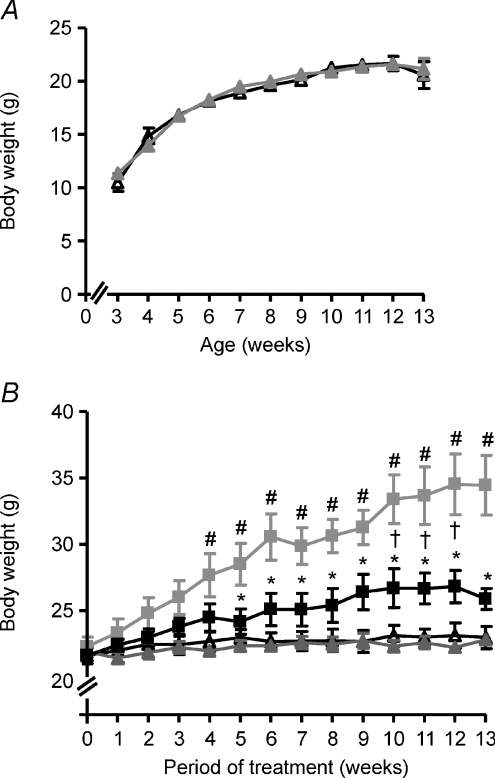
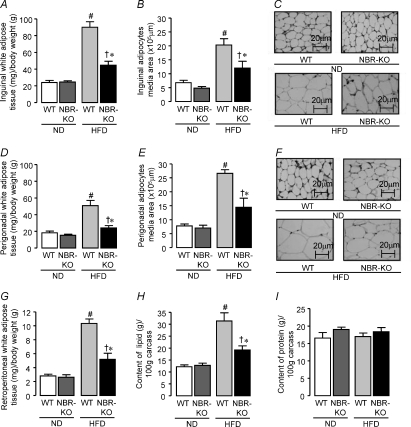
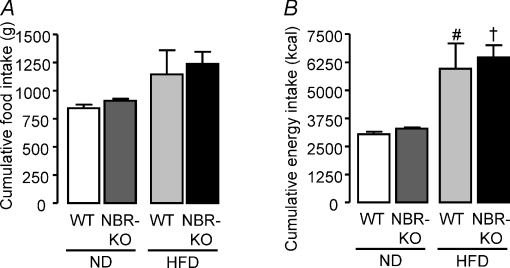
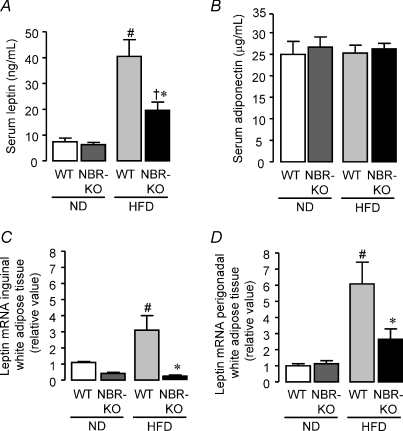
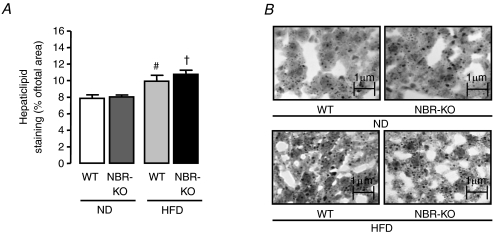
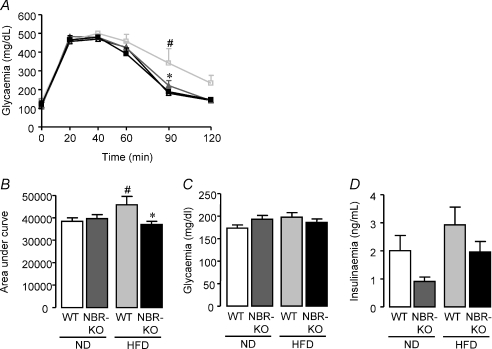
Previous studies have proposed a role for neuromedin B (NB), a bombesin-like peptide, in the control of body weight homeostasis. However, the nature of this role is unclear. The actions of NB are mediated preferentially by NB-preferring receptors (NBRs). Here we examined the consequences of targeted deletion of NBRs in female mice on body weight homeostasis in mice fed a normolipid diet (ND) or a high-fat diet (HFD) for 13 weeks. Body weight and food ingestion of neuromedin B receptor knockout (NBR-KO) mice fed a normolipid diet showed no difference in relation to wild-type (WT). However, the high-fat diet induced an 8.9- and 4.8-fold increase in body weight of WT and NBR-KO, respectively, compared to their controls maintained with a normolipid diet, even though the mice ingested the same amount of calories, regardless of genotype. Comparing mice fed the high-fat diet, NBR-KO mice accumulated approximately 45% less fat depot mass than WT, exhibited a lower percentage of fat in their carcasses (19.2 vs. 31.3%), and their adipocytes were less hypertrophied. Serum leptin and leptin mRNA in inguinal and perigonadal fat were lower in HFD NBR-KO than HFD WT, and serum adiponectin was similar among HFD groups and unaltered in comparison to ND-fed mice. HFD-fed WT mice developed glucose intolerance but not the HFD-fed NBR-KO mice, although they had similar glycaemia and insulinaemia. NBR-KO and WT mice on the normolipid diet showed no differences in any parameters, except for a trend to lower insulin levels. Therefore, disruption of the neuromedin B receptor pathway did not change body weight homeostasis in female mice fed a normolipid diet; however, it did result in partial resistance to diet-induced obesity.


Figures

Figure 1
Figure 1
A, body weight of wild-type (WT, black triangles) and neuromedin B receptor knockout (NBR-KO, grey triangles) mice fed standard chow from weaning at 3 weeks old to 13 weeks old. Values are expressed as means ±s.e.m. WT, n= 12; NBR-KO, n= 12. B, body weight of WT and NBR-KO mice fed a normolipid diet (WT ND, black triangles; NBR-KO ND, grey triangles) or high-fat diet (WT HFD, grey squares; NBR-KO HFD, black squares) over 13 weeks, starting when animals were 13 weeks old. Values are expressed as means ±s.e.m.n= 6 animals per group. # WT ND vs. WT HFD, † NBR-KO ND vs. NBR-KO HFD, * WT HFD vs. NBR-KO HFD (P < 0.05).
Figure 3
Figure 3. White adipose tissue morphology in WT and NBR-KO mice fed a normolipid or high-fat diet for 13 weeks
Mass of inguinal (A), perigonadal (D) and retroperitoneal (G) white adipose tissue. Area of inguinal (B) and perigonadal (E) white adipocytes. Haematoxylin–eosin-stained histological sections of inguinal (C) and perigonadal (F) white adipose tissue. Percentage lipid (H) and protein (I) contents in eviscerated carcasses. Values are expressed as means ±s.e.m.n= 6 animals per group. # WT ND vs. WT HFD, † NBR-KO ND vs. NBR-KO HFD, * WT HFD vs. NBR-KO HFD (P < 0.05).
Figure 2
Figure 2
Total amount of food intake (A) and energy intake (B) of WT and NBR-KO mice fed a normolipid diet (ND) or a high-fat diet (HFD) for 13 weeks. Values are expressed as means ±s.e.m.n= 2 cages with 3 mice per group. # WT ND vs. WT HFD, † NBR-KO ND vs. NBR-KO HFD (P < 0.05).
Figure 4
Figure 4. Adipocyte hormones in WT and NBR-KO mice fed a normolipid or high-fat diet for 13 weeks
A, serum leptin, n= 6 per group, except for NBR-KO ND (n= 5). B, serum adiponectin, n= 6 per group, except for NBR-KO ND (n= 5). C, relative expression of inguinal white adipose tissue leptin mRNA (normalized by 36B4) to values of WT animals on normolipid diet (set as 1). Data were obtained by quantitative PCR. Values are means ±s.e.m.n= 5 per group, except for WT ND (n= 4). D, relative expression of perigonadal white adipose tissue leptin mRNA (normalized by 36B4) to values of WT animals on a normolipid diet (set as 1). Values are means ±s.e.m.n= 6 per group, except for WT HFD (n= 5). # WT ND vs. WT HFD, † NBR-KO ND vs. NBR-KO HFD, * WT HFD vs. NBR-KO HFD (P < 0.05).
Figure 5
Figure 5. Hepatic lipid deposition of WT and NBR-KO mice fed a normolipid or high-fat diet for 13 weeks
A, percentage of the sum of Oil Red O-stained area in relation to the total analysed area. B, Oil Red O-stained sections of liver. Values are means ±s.e.m.n= 5 animals per group. # WT ND vs. WT HFD, † NBR-KO ND vs. NBR-KO HFD (P < 0.05).
Figure 6
Figure 6. Glucose homeostasis in WT and NBR-KO mice fed a normolipid or high-fat diet for 13 weeks
A, glucose tolerance test: blood glucose was measured at time zero (following an overnight fast), and after intraperitoneal injection of glucose. n= 6 per group (WT ND, black squares; NBR-KO ND, black triangles; WT HFD, grey squares; NBR-KO HFD, grey triangles). B, area under the curve during the glucose tolerance test of WT and NBR-KO fed ND or HFD. C, fed blood glucose concentrations of WT and NBR-KO on ND or HFD. Values are expressed as means ±s.e.m.n= 6 per group. D, fed serum insulin concentrations of WT and NBR-KO on ND or HFD. Values are expressed as means ±s.e.m.n= 6 per group, except for NBR-KO HFD (n= 5). # WT ND vs. WT HFD, * WT HFD vs. NBR-KO HFD (P < 0.05).

Comment in

  • To B or not to B: Fat is the question.
    Ladenheim EE. Ladenheim EE. J Physiol. 2010 May 1;588(Pt 9):1393-4. doi: 10.1113/jphysiol.2010.190165. J Physiol. 2010. PMID: 20436044 Free PMC article. No abstract available.

Similar articles

Cited by

References

    1. Bouchard L, Drapeau V, Provencher V, Lemieux S, Chagnon Y, Rice T, Rao DC, Vohl MC, Tremblay A, Bouchard C, Pérusse L. Neuromedin β: a strong candidate gene linking eating behaviors and susceptibility to obesity. Am J Clin Nutr. 2004;80:1478–1486. - PubMed
    1. Bradford MM. A rapid and sensitive method for the quantitation of microgram quantities of protein utilizing the principle of protein-dye binding. Anal Biochem. 1976;72:248–254. - PubMed
    1. Drummond GB. Reporting ethical matters in The Journal of Physiology: standards and advice. J Physiol. 2009;587:713–719. - PMC - PubMed
    1. Gibbs J, Smith GP. The actions of bombesin-like peptides on food intake. Ann N Y Acad Sci. 1988;547:210–216. - PubMed
    1. Gonzalez N, Moody TW, Igarashi H, Ito T, Jensen RT. Bombesin-related peptides and their receptors: recent advances in their role in physiology and disease states. Curr Opin Endocrinol Diab Obes. 2008;15:58–64. - PMC - PubMed

Publication types

MeSH terms