. 2010 May;24(5):886-97.
doi: 10.1210/me.2009-0286. Epub 2010 Mar 8.

FXR regulates liver repair after CCl4-induced toxic injury

Affiliations

FXR regulates liver repair after CCl4-induced toxic injury

Zhipeng Meng et al. Mol Endocrinol. 2010 May.

Abstract

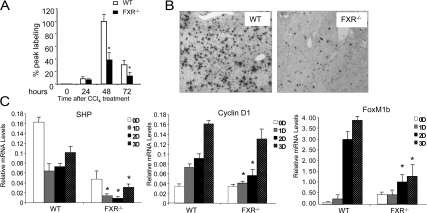
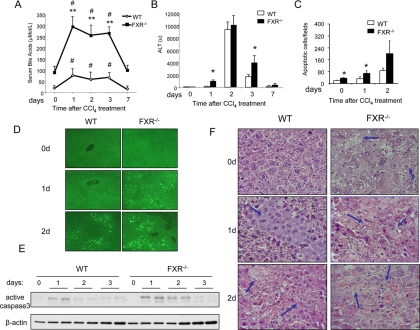
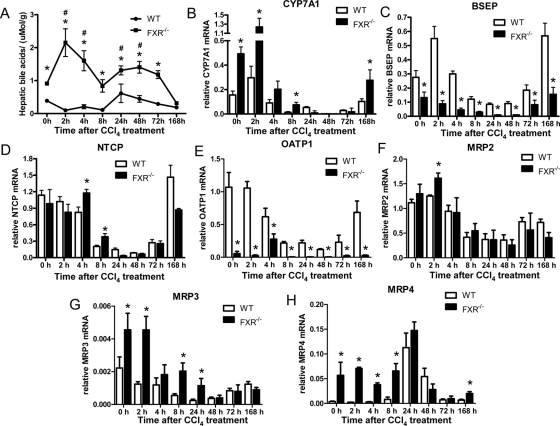
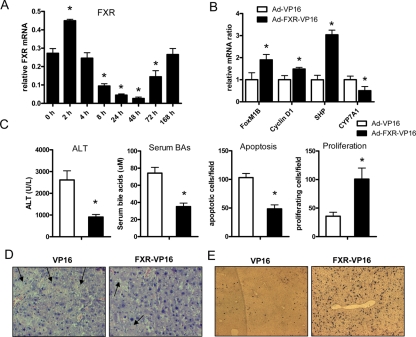
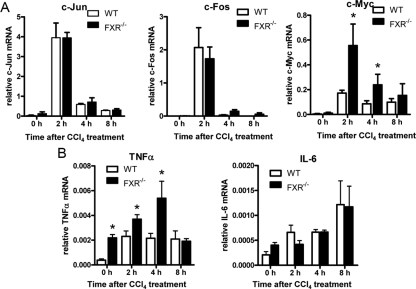
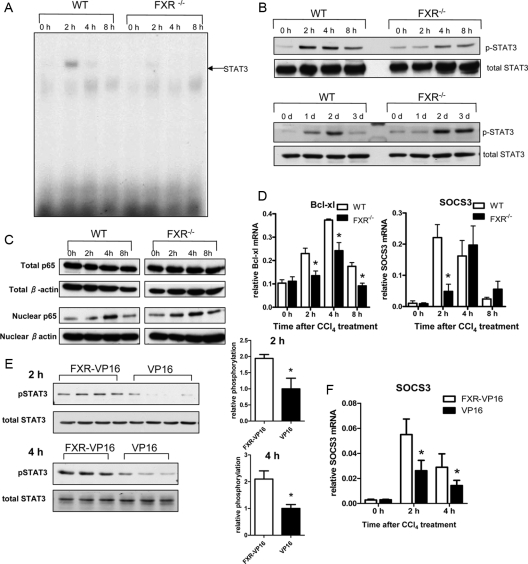
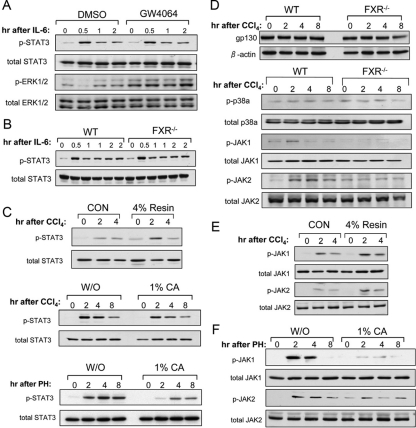
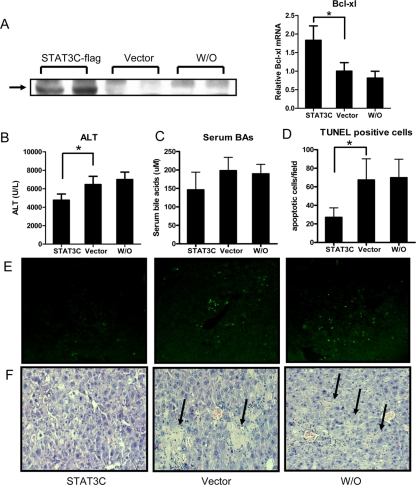
Liver repair is key to resuming homeostasis and preventing fibrogenesis as well as other liver diseases. Farnesoid X receptor (FXR, NR1H4) is an emerging liver metabolic regulator and cell protector. Here we show that FXR is essential to promote liver repair after carbon tetrachloride (CCl(4))-induced injury. Expression of hepatic FXR in wild-type mice was strongly suppressed by CCl(4) treatment, and bile acid homeostasis was disrupted. Liver injury was induced in both wild-type and FXR(-/-) mice by CCl(4), but FXR(-/-) mice had more severe defects in liver repair than wild-type mice. FXR(-/-) livers had a decreased peak of regenerative DNA synthesis and reduced induction of genes involved in liver regeneration. Moreover, FXR(-/-) mice displayed increased mortality and enhanced hepatocyte deaths. During the early stages of liver repair after CCl(4) treatment, we observed overproduction of TNFalpha and a strong decrease of phosphorylation and DNA-binding activity of signal transducer and activator of transcription 3 in livers from FXR(-/-) mice. Exogenous expression of a constitutively active signal transducer and activator of transcription 3 protein in FXR(-/-) liver effectively reduced hepatocyte death and liver injury after CCl(4) treatment. These results suggest that FXR is required to regulate normal liver repair by promoting regeneration and preventing cell death.


Figures

Figure 1
Figure 1
Defective liver regeneration in FXR−/− mice after CCl4-induced liver injury. A, The BrdU-positive liver cells were counted as described previously (17). *, P < 0.05. B, Representative images of BrdU staining of liver tissue from wild-type (WT) and FXR−/− mice on the second day after CCl4 treatment. C, Gene expression analysis of SHP, FoxM1b, and CyclinD1 by quantitative real-time PCR. *, P < 0.05.
Figure 2
Figure 2
Increased hepatocyte apoptosis and liver injury in FXR−/− livers after CCl4 treatment. A, Serum BA levels in wild-type (WT) or FXR−/− mice after CCl4 treatment. **, FXR−/−vs. WT, P < 0.01; #, serum BAs of FXR−/− mice treated with CCl4vs. serum BAs of FXR−/− mice at time zero. B, Serum ALT levels in WT or FXR−/− mice after CCl4 treatment. *, P < 0.05. C, Quantification of apoptotic hepatocytes. *, P < 0.05. D, Terminal deoxynucleotide transferase-mediated dUTP nick end labeling staining of liver sections from WT and FXR−/− mice after CCl4 treatment (0, 1, or 2 d after treatment). E, Caspase 3 activation after CCl4 injection in WT and FXR−/− mice. F, H&E staining of liver tissue sections from WT and FXR−/− mice after CCl4 treatment. Arrows indicate necrosis areas.
Figure 3
Figure 3
Intrahepatic cholestasis of FXR−/− mice after CCl4 treatment. A, Hepatic BAs were measured as described in Materials and Methods. *, FXR−/−vs. wild type (WT), P < 0.05; #, hepatic BAs of FXR−/− mice treated with CCl4vs. hepatic BAs of FXR−/− mice at zero time. B–H, Quantitative real-time PCR analysis of CYP7A, BSEP, NTCP, OATP1, and MRP2/3/4 expression. The quantity of mRNA was normalized using the internal standard, m36B4. *, P < 0.05.
Figure 4
Figure 4
Overexpression of a constitutively active FXR (FXR-VP16)-suppressed liver injury caused by CCl4. A, mRNA levels of FXR at the different time points after CCl4 injection. *, One-way ANOVA test followed by a post hoc test (Dunnett’s Multiple Comparison Test) compared with control group, P < 0.05. B, Gene expression analysis in the wild-type mice infected by adenovirus (Ad)-expressing FXR-VP16 or VP16 alone 40 h after CCl4 treatment. C, Serum ALT, serum BAs, Terminal deoxynucleotide transferase-mediated dUTP nick end labeling, and BrdU staining in the mice treated with FXR-VP16 adenovirus or VP-16 adenovirus 40 h after CCl4 treatment. *, P < 0.05. D, Representative figures of H&E staining. Arrows indicate necrosis. E, Representative figures of BrdU staining.
Figure 5
Figure 5
Expression analysis of early response genes in liver tissues from CCl4-treated wild-type (WT) and FXR−/− mice. Total hepatic RNA was prepared from wild-type and FXR−/− mice and subjected to quantitative real-time PCR analysis. A, Acute phase protooncogenes c-jun, c-fos, and c-myc. B, Inflammatory cytokines TNFα and IL-6. The quantity of mRNA was normalized using the internal standard, m36B4. *, P < 0.05.
Figure 6
Figure 6
Impaired STAT3 activation after CCl4 treatment in FXR−/− mice. A, EMSA analysis of nuclear proteins (8 μg) extracted from pooled livers of four to six mice at the indicated times after CCl4 injections. Arrow indicates STAT3 homodimer. B, Western blot analysis of total protein extracts (30 μg) from the same liver samples as in panel A and the samples collected at later time points (1, 2, and 3 d). Blots were probed for STAT3 Tyr705 phosphorylation or total STAT3 protein levels using corresponding antibodies. C, Immunoblot analysis of total liver lysates or nuclear liver lysates (30 μg) from CCl4-treated mice at the indicated time points after treatment. Blots were probed with anti-p65 and anti-β-actin antibody. D, mRNA levels of STAT3 target genes Bcl-xl and SOCS3. *, P < 0.05. E, Immunoblot of phospho-STAT3 in the FXR−/− mice infected with adenovirus. F, Real-time PCR analysis of SOCS3 in the FXR−/− mice infected with adenovirus. *, P < 0.05. SOCS, Suppressor of cytokine signaling; WT, wild type.
Figure 7
Figure 7
High BA levels suppress STAT3 phosphorylation during liver regeneration. A, Primary hepatocytes from 8-wk-old wild-type mice were pretreated with 2 μm GW4064 or dimethylsulfoxide (DMSO) for 24 h and then treated with 10 ng/ml recombinant mouse IL-6. The total lysates from the hepatocytes were analyzed with Western blot. B, IL-6 induced STAT3 phosphorylation in wild-type (WT) and FXR−/− primary hepatocytes. C, Immunoblot analysis of STAT3 phosphorylation in total protein extracts pooled from livers of four to six FXR−/− mice prefed with a powdered diet supplemented with 4% cholestyramine (resin) or a control powdered diet (CON) for 5 d at the indicated time points after CCl4 treatment, STAT3 phosphorylation in total protein extracts pooled from livers of four to six WT mice either received 1% CA feeding or normal diet (W/O) for 5 d and terminated at the indicated time points after CCl4 treatment, and STAT3 phosphorylation in total liver protein extracts pooled from four WT mice that received the 1% CA-containing diet after 70% PH. D, Immunoblot analysis of gp130 protein levels, and phosphorylation of p38α, JAK1, and JAK2 in the liver of WT mice and FXR−/− mice after CCl4 treatment. E, Immunoblot analysis of JAK1 and JAK2 phosphorylation in the FXR−/− mice fed with the 4% Resin-containing diet after CCl4 treatment. F, Immunoblot analysis of phosphorylation of JAK1 and JAK2 in the livers of WT mice fed with normal diet (W/O) or 1% CA-containing diet after 70% PH.
Figure 8
Figure 8
Suppression of CCl4-induced hepatocyte death by a constitutively active STAT3 in FXR−/− livers. A, Immunoblot analysis of ectopic STAT3 expression and real-time PCR analysis of STAT3 target gene Bcl-xl. Total protein extracts (30 μg) were pooled from livers of four mice that were hydrodynamically injected with constitutively active STAT3 (STAT3C). Liver samples were harvested 24 h after CCl4 injections. Blots were probed with anti-flag antibody. Vector indicates the mice injected with the pCMV/Rc plasmid without insertion of STAT3C sequence; W/O indicates the mice with mock saline injection. B and C, Serum ALT (B) and BAs (C) levels in the indicated groups of FXR−/− mice. *, P < 0.05. D, Quantification of terminal deoxynucleotide transferase-mediated dUTP nick end labeling (TUNEL)-positive cells in randomly chosen fields. *, P < 0.05. E, Representative TUNEL-stained liver sections. F, Representative H&E-stained liver sections. Arrows indicate necrosis areas.

Similar articles

Cited by

References

    1. Forman BM, Goode E, Chen J, Oro AE, Bradley DJ, Perlmann T, Noonan DJ, Burka LT, McMorris T, Lamph WW, Evans RM, Weinberger C 1995 Identification of a nuclear receptor that is activated by farnesol metabolites. Cell 81:687–693 - PubMed
    1. Makishima M, Okamoto AY, Repa JJ, Tu H, Learned RM, Luk A, Hull MV, Lustig KD, Mangelsdorf DJ, Shan B 1999 Identification of a nuclear receptor for bile acids. Science 284:1362–1365 - PubMed
    1. Parks DJ, Blanchard SG, Bledsoe RK, Chandra G, Consler TG, Kliewer SA, Stimmel JB, Willson TM, Zavacki AM, Moore DD, Lehmann JM 1999 Bile acids: natural ligands for an orphan nuclear receptor. Science 284:1365–1368 - PubMed
    1. Wang H, Chen J, Hollister K, Sowers LC, Forman BM 1999 Endogenous bile acids are ligands for the nuclear receptor FXR/BAR. Mol Cell 3:543–553 - PubMed
    1. Goodwin B, Jones SA, Price RR, Watson MA, McKee DD, Moore LB, Galardi C, Wilson JG, Lewis MC, Roth ME, Maloney PR, Willson TM, Kliewer SA 2000 A regulatory cascade of the nuclear receptors FXR, SHP-1, and LRH-1 represses bile acid biosynthesis. Mol Cell 6:517–526 - PubMed

Publication types

MeSH terms

Substances