

Responses of single chorda tympani taste fibers of the calf (Bos taurus)
- PMID: 20212013
- PMCID: PMC2871778
- DOI: 10.1093/chemse/bjq026
Responses of single chorda tympani taste fibers of the calf (Bos taurus)
Abstract
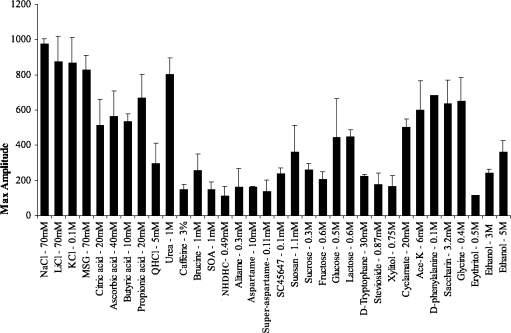
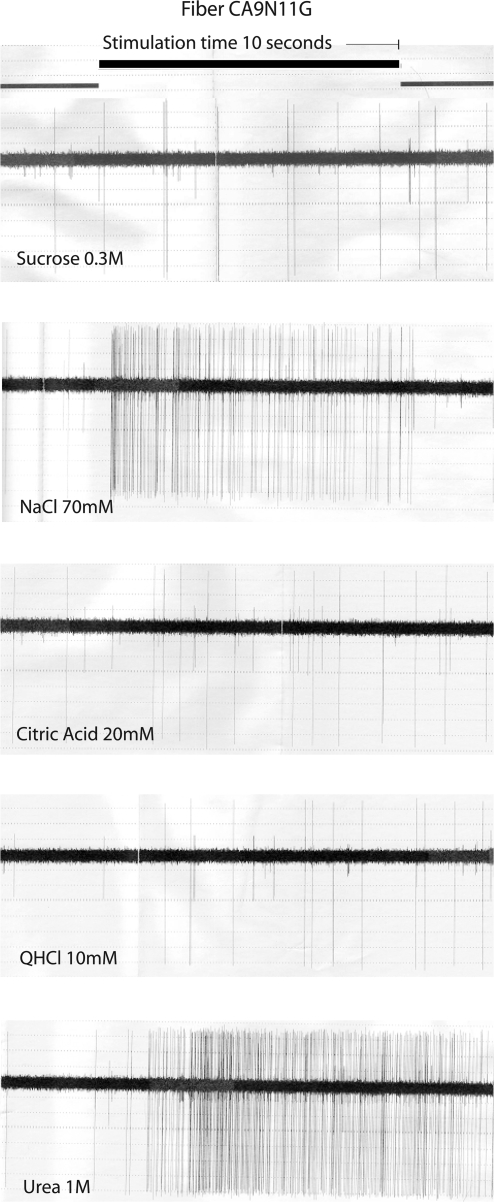
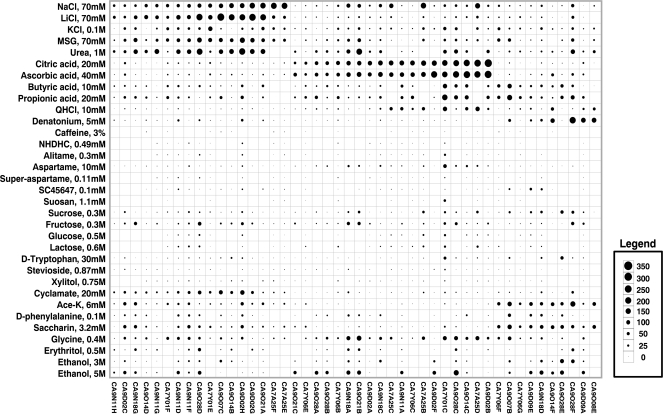
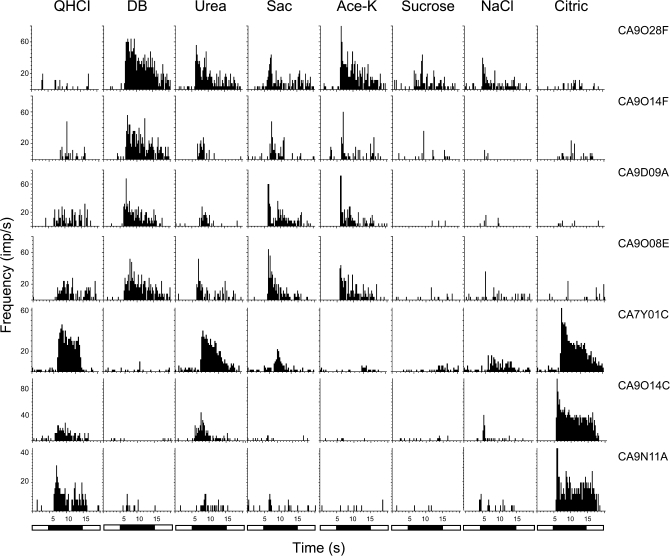
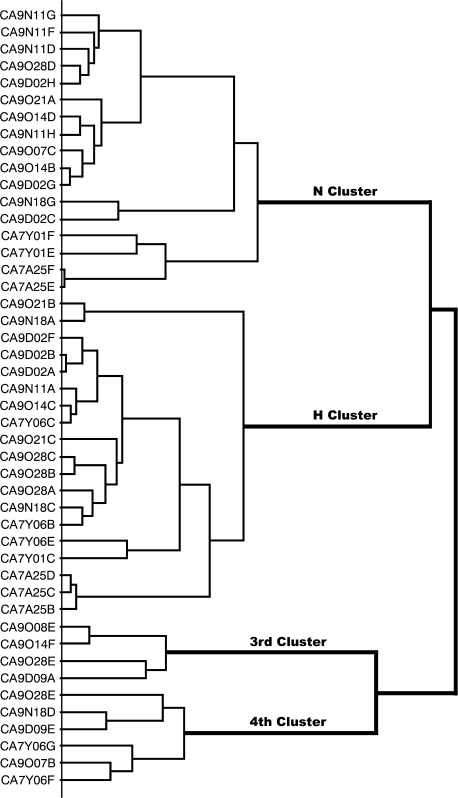
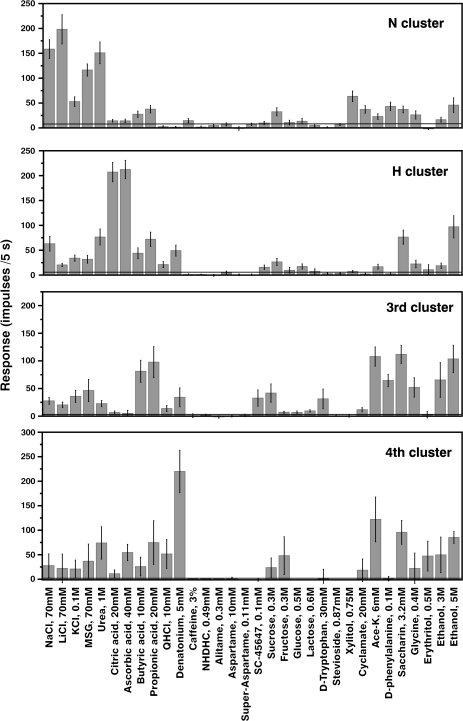
In spite of a wealth of information on feed and nutrition in cattle, there little is published of what they actually can taste. Here, we attempt to remedy some of this deficiency by presenting recordings of the chorda tympani proper nerve of young Holstein calves during stimulation of approximately 30 compounds. Hierarchical cluster analysis of 46 single taste fibers separated 4 fiber clusters: N (salt best), H (sour best), and 2 clusters, which could not be related to any human taste quality. The N fibers responded best to LiCl, NaCl, urea, monosodium glutamate, and KCl, whereas the H fibers responded strongly to citric and ascorbic acid. Interestingly, propionic and butyric acid stimulated best the 3rd cluster, whereas the 4th cluster responded best to denatonium benzoate and only to a small extent to quinine hydrochloride. Sweeteners stimulated moderately all clusters. Beginning with the largest response to sweet, the order between the responses was: acesulfame-K, saccharin, D-phenylalanine, glycine, sucrose, fructose, erythritol, cyclamate, and lactose. Alitame, aspartame, and super-aspartame evoked no or little responses. Three and 5 M ethanol stimulated all clusters. Comparison with taste fibers in other species suggests that the taste world of cattle is quite different from other species'.
Figures
Similar articles
-
Primate sense of taste: behavioral and single chorda tympani and glossopharyngeal nerve fiber recordings in the rhesus monkey, Macaca mulatta.J Neurophysiol. 1997 Feb;77(2):978-93. doi: 10.1152/jn.1997.77.2.978. J Neurophysiol. 1997. PMID: 9065862
-
The sweet taste quality is linked to a cluster of taste fibers in primates: lactisole diminishes preference and responses to sweet in S fibers (sweet best) chorda tympani fibers of M. fascicularis monkey.BMC Physiol. 2009 Feb 18;9:1. doi: 10.1186/1472-6793-9-1. BMC Physiol. 2009. PMID: 19224647 Free PMC article.
-
The taste of ethanol in a primate model. II. Glossopharyngeal nerve response in Macaca mulatta.Alcohol. 2000 Jul;21(3):259-69. doi: 10.1016/s0741-8329(00)00094-x. Alcohol. 2000. PMID: 11091030
-
Chorda tympani responses in two inbred strains of mice with different taste preferences.Physiol Behav. 1999 Aug;67(2):287-97. doi: 10.1016/s0031-9384(99)00071-2. Physiol Behav. 1999. PMID: 10477061 Review.
-
The organization of taste sensibilities in hamster chorda tympani nerve fibers.J Gen Physiol. 1988 Jun;91(6):861-96. doi: 10.1085/jgp.91.6.861. J Gen Physiol. 1988. PMID: 3047313 Free PMC article. Review.
Cited by
-
Sweet taste receptor gene variation and aspartame taste in primates and other species.Chem Senses. 2011 Jun;36(5):453-75. doi: 10.1093/chemse/bjq145. Epub 2011 Mar 16. Chem Senses. 2011. PMID: 21414996 Free PMC article.
-
Comparison of the responses of the chorda tympani and glossopharyngeal nerves to taste stimuli in C57BL/6J mice.BMC Neurosci. 2003 Mar 4;4:5. doi: 10.1186/1471-2202-4-5. Epub 2003 Mar 4. BMC Neurosci. 2003. PMID: 12617752 Free PMC article.
-
Endocannabinoid administration affects taste preference and the expression of cannabinoid and opioid receptors in the amygdala of early lactating cows.Sci Rep. 2023 Mar 27;13(1):4967. doi: 10.1038/s41598-023-31724-3. Sci Rep. 2023. PMID: 36973308 Free PMC article.
-
Neuroscience of taste: unlocking the human taste code.BMC Neurosci. 2024 Mar 21;25(1):19. doi: 10.1186/s12868-024-00847-2. BMC Neurosci. 2024. PMID: 38515045 Free PMC article. Review.
-
Distinct neural ensembles in the rat gustatory cortex encode salt and water tastes.J Physiol. 2012 Jul 1;590(13):3169-84. doi: 10.1113/jphysiol.2012.233486. Epub 2012 May 8. J Physiol. 2012. PMID: 22570382 Free PMC article.
References
-
- Baldwin BA, Bell FR, Kitchell RL. Gustatory nerve impulses in ruminant ungulates. J Physiol (Lond) 1959;146:14P–15P.
-
- Bell FR. The sense of taste in domesticated animals. Vet Rec. 1959;71:1071–1079.
-
- Bell FR. The variation in taste thresholds of ruminants associated with sodium depletion. In: Zotterman Y, editor. Olfaction and taste I. Oxford: Pergamon Press; 1963. pp. 299–307.
-
- Bell FR, Sly J. The olfactory discrimination of salt by cattle. In: van der Starre H, editor. Proceedings of the Seventh International Symposium on Olfaction and Taste and the fourth Congress of the European Chemoreception Research Organization; 1980 July 22–25 July; London. Washington (DC): IRL Press Ltd: 1980. pp. 343–347.
Publication types
MeSH terms
Substances
Grants and funding
LinkOut - more resources
Full Text Sources
