. 2010 Mar 23;107(12):5369-74.
doi: 10.1073/pnas.0914365107. Epub 2010 Mar 8.

Monomeric red fluorescent proteins with a large Stokes shift

Affiliations

Monomeric red fluorescent proteins with a large Stokes shift

Kiryl D Piatkevich et al. Proc Natl Acad Sci U S A. .

Abstract

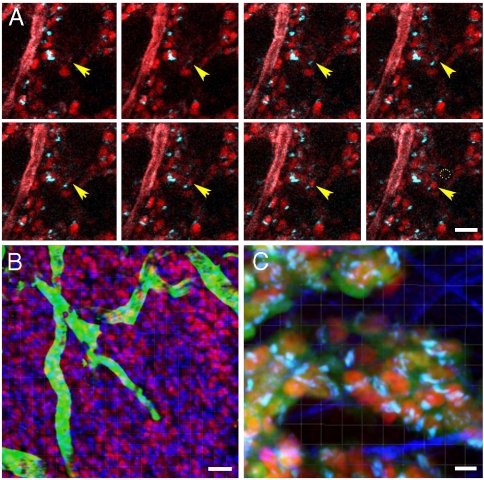
Two-photon microscopy has advanced fluorescence imaging of cellular processes in living animals. Fluorescent proteins in the blue-green wavelength range are widely used in two-photon microscopy; however, the use of red fluorescent proteins is limited by the low power output of Ti-Sapphire lasers above 1,000 nm. To overcome this limitation we have developed two red fluorescent proteins, LSS-mKate1 and LSS-mKate2, which possess large Stokes shifts with excitation/emission maxima at 463/624 and 460/605 nm, respectively. These LSS-mKates are characterized by high pH stability, photostability, rapid chromophore maturation, and monomeric behavior. They lack absorbance in the green region, providing an additional red color to the commonly used red fluorescent proteins. Substantial overlap between the two-photon excitation spectra of the LSS-mKates and blue-green fluorophores enables multicolor imaging using a single laser. We applied this approach to a mouse xenograft model of breast cancer to intravitally study the motility and Golgi-nucleus alignment of tumor cells as a function of their distance from blood vessels. Our data indicate that within 40 mum the breast cancer cells show significant polarization towards vessels in living mice.


Conflict of interest statement

The authors declare no conflict of interest.

Figures

Fig. 1.
Fig. 1.
Spectral, biochemical, and photobleaching properties of LSS-mKate1 (solid line), LSS-mKate2 (dashed line), and mKeima (dotted line). (A) Normalized fluorescence one-photon excitation and emission spectra. (B) Fluorescence maturation kinetics. (C) pH dependence of fluorescence. (D) Normalized curves of photobleaching in aqueous drops in oil using wide-field epifluorescent illumination measured for LSS-mKates, mKeima, and EGFP (dashed-dotted line). (E) Two-photon action cross-sections (σ2PE) measured for LSS-mKates, mKeima, EGFP, and ECFP (double-dashed-dotted line). (F) Photobleaching curves for the proteins targeted to nuclei of live HeLa cells measured using 2PE at 870 nm. Each curve represents data averaged over 16–20 cells.
Fig. 2.
Fig. 2.
Changes of the one-photon excitation fluorescence spectra for the purified (A) LSS-mKate1, (B) LSS-mKate2, and (C) mKeima proteins in the physiological pH range of 5.0–8.0. Emission of the protein samples was detected at 675 nm.
Fig. 3.
Fig. 3.
LSS-mKate1, LSS-mKate2, and mKeima proteins fused to H2B (A), cytochrome C oxidase subunit VIII (B) or α-actinin (C) were coexpressed with either mCherry-α-tubulin (A), TagRFP-α-actinin (B) or mKate-VSVG (C) in live HeLa cells. The large Stokes shift fluorescence images (left columns; red color) were acquired using 436/20 excitation and 605/40 emission filters. The standard red fluorescence images (middle columns; green pseudocolor) were acquired using 570/30 excitation and 615/40 emission filters. The right columns are the overlay of the left and center columns. Bars are 10 μm.
Fig. 4.
Fig. 4.
Intravital imaging of tumor cell motility using 2PE. MTLn3 cells overexpressing ErbB1 with stable coexpression of NLS-LSS-mKate1 (nucleus, red) and GalT-ECFP (Golgi, blue) were imaged. FITC-labeled 70 kDa dextran was injected prior to the start of imaging. (A) Series of still images extracted from 40-min time-lapse sequence shows a nucleus-Golgi pair (yellow arrows) migrating into the plane and through the tumor, while the dotted circle (40-min image) indicates the original entry position of the nucleus-Golgi pair. The FITC-labeled blood vessels appear in red. (B) Three color image of NLS-LSS-mKate1 (nucleus, red), GalT-ECFP (Golgi, blue) with FITC-conjugated 70 kDa dextran (vasculature, green, injected into the tail vein). Z-series were captured at 2 μm steps, and 3D reconstruction was processed using Imaris software. (C) MTLn3 cells stably coexpressing GalT-ECFP (Golgi, cyan), NLS-LSS-mKate1 (nucleus, red), and EGFP (cytoplasm, green) were imaged simultaneous with second-harmonic generated signal from collagen fibers (blue). Complete sets of the time-lapse images B and C are available as Movies S5 and S6, respectively. All images were captured using a single 870 nm wavelength 2PE and 20× NA 0.95 objective lens. Bars are 50 μm (A, B) and 10 μm (C).
Fig. 5.
Fig. 5.
In vivo nucleus-Golgi alignment and cell polarization imaged using 2PE. MTLn3 cells overexpressing ErbB1 with stable coexpression of NLS-LSS-mKate1 (nucleus, red), and GalT-ECFP (Golgi, blue) were imaged. FITC-labeled 70 kDa dextran was injected prior to the start of imaging. (A) Still image from 40 μm thick Z-series shows nucleus-Golgi pairs (yellow arrows) aligned adjacent to a tumor blood vessel. Bar is 50 μm. (B) Diagram indicating method for calculation of angle of nucleus-Golgi axis relative to perpendicular distance from vessel. Nucleus-vessel distances were calculated to linear line segments [examples shown in (A) yellow-dotted lines labeled as 1, 2 and 3]. (C) Analysis of nucleus-Golgi-vessel angles. Horizontal axis displays vessel to nucleus distances, vertical axis displays the number of nucleus-Golgi pairs displaying either a low angle (< 90°, black bars) or high angle (> 90°, gray bars) as calculated relative to the nearest blood vessel segment. Data are displayed as mean ± SEM. Bar graph (D) displays the ratio of the number of low angled nucleus-Golgi pairs (< 90°) to high angled nucleus-Golgi pairs (> 90°) in the 0–40 μm range for 21 different vessel segments.

References

    1. Stepanenko OV, et al. Fluorescent proteins as biomarkers and biosensors: Throwing color lights on molecular and cellular processes. Curr Protein Pept Sc. 2008;9:338–369. - PMC - PubMed
    1. Hoffman RM. Imaging cancer dynamics in vivo at the tumor and cellular level with fluorescent proteins. Clin Exp Metastasis. 2009;26:345–355. - PubMed
    1. Wyckoff JB, et al. Direct visualization of macrophage-assisted tumor cell intravasation in mammary tumors. Cancer Res. 2007;67:2649–2656. - PubMed
    1. Rubart M. Two-photon microscopy of cells and tissue. Circ Res. 2004;95:1154–1166. - PubMed
    1. Wang W, et al. Single cell behavior in metastatic primary mammary tumors correlated with gene expression patterns revealed by molecular profiling. Cancer Res. 2002;62:6278–6288. - PubMed

Publication types

MeSH terms

Substances

LinkOut - more resources