. 2010 Mar 23;107(12):5405-10.
doi: 10.1073/pnas.1001705107. Epub 2010 Mar 8.

Maximum entropy models for antibody diversity

Affiliations

Maximum entropy models for antibody diversity

Thierry Mora et al. Proc Natl Acad Sci U S A. .

Abstract

Recognition of pathogens relies on families of proteins showing great diversity. Here we construct maximum entropy models of the sequence repertoire, building on recent experiments that provide a nearly exhaustive sampling of the IgM sequences in zebrafish. These models are based solely on pairwise correlations between residue positions but correctly capture the higher order statistical properties of the repertoire. By exploiting the interpretation of these models as statistical physics problems, we make several predictions for the collective properties of the sequence ensemble: The distribution of sequences obeys Zipf's law, the repertoire decomposes into several clusters, and there is a massive restriction of diversity because of the correlations. These predictions are completely inconsistent with models in which amino acid substitutions are made independently at each site and are in good agreement with the data. Our results suggest that antibody diversity is not limited by the sequences encoded in the genome and may reflect rapid adaptation to antigenic challenges. This approach should be applicable to the study of the global properties of other protein families.


Conflict of interest statement

The authors declare no conflict of interest.

Figures

Fig. 1.
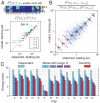
Fig. 1.
Maximum entropy model. (A) The model of the D region is viewed as a system of interacting residues (σ1,…,σL) in thermal equilibrium, schematized here by its interaction network for K = 2. To each sequence σ is associated an energy E(σ) (Eq. 3). Then the sequences of the repertoires are drawn at random from the Boltzmann distribution (Eq. 2). (B) Fit quality and control for overfitting. Pairwise frequencies of nearest- (k = 1, red) and second-nearest neighbor (k = 2, yellow) residues. (Left) Comparison between the model prediction, where the model was fitted with the training data, and the testing data. (In this figure the maximum interaction range is K = 2, but K = 1, 3, and 4 gave similar results.) (Right) Direct comparison between the training data and the testing data. The scatter is of the same magnitude, showing that the model is as precise as the data allow.
Fig. 2.
Fig. 2.
Local observables and the entropy are well captured by the model. (A) Position-dependent amino acid frequency. (Top) Frequency as a function of position i = 1,…,4 from the left end of the sequence. (Bottom) Comparison between model and data of position-dependent frequencies, normalized by the prediction of the independent model. Error bars are obtained as the standard deviation over many choices of partition between training and testing sets. (B) Comparison of triplet frequencies of contiguous amino acids, normalized by the prediction of the independent model. The small crosses illustrate one choice of the training/testing partition. The black error bars represent the average measurement error made on a triplet frequency at that frequency value, obtained as the standard deviation over many choices of the training/testing partition. The diagonal error bars show the average error between model and data. (C) Entropy of all fish: from frequency counting, from the independent model, and from the maximum entropy model with range K = 1,…,4.
Fig. 3.
Fig. 3.
The distribution of D regions obeys Zipf’s law. Probability of D region sequences as a function of their rank in fish A, as observed from frequency counting (Blue Line), and as predicted by the independent (Green Line) and the maximum entropy model with K = 2 (Red Line). The dashed line has slope -1. (Inset) The same for all fish, from frequency counting.
Fig. 4.
Fig. 4.
Fish repertoires overlap yet are specific. Mutual information between fish and sequence vs. the entropy of fish. Each point is a subgroup of all 13 fish (excluding fish F), color-coded by its size (from dark blue to red). Filled circles are averages over groups of each size. (Upper Inset) Comparison between mutual information estimated from counting observed sequences and that predicted by the maximum entropy model. (Lower Inset) Mutual information vs. fish entropy, as predicted by the independent model.
Fig. 5.
Fig. 5.
Metastable states (data from fish A). (A) Lower: Scores of pairwise alignments between the genomic segments D1–D5 and the metastable states. The bar plot represents the total weight of the basins of attraction of each metastable state. Upper: Scores of alignments of the genomic segments with themselves and with each other are shown for comparison. (B) Basins of attractions of the 7 most populated states. A density plot represents the energy of the sequences vs. the number of steps separating them from their metastable state by steepest descent. (C) Connectivity of the sequence space. Lines indicate the existence of paths of adjacent sequences between two metastable states. When the link is a solid line, there exists a path made only of single-nucleotide mutations.

References

    1. Pal C, Papp B, Lercher M. An integrated view of protein evolution. Nat Rev Genet. 2006;7:337–348. - PubMed
    1. Branden C, Tooze J. Introduction to Protein Structure. New York: Garland Science; 1991.
    1. Cordes MH, Davidson AR, Sauer RT. Sequence space, folding and protein design. Curr Opin Struct Biol. 1996;6:3–10. - PubMed
    1. Socolich M, et al. Evolutionary information for specifying a protein fold. Nature. 2005;437:512–518. - PubMed
    1. Russ WP, Lowery DM, Mishra P, Yaffe MB, Ranganathan R. Natural-like function in artificial ww domains. Nature. 2005;437:579–583. - PubMed

Publication types

LinkOut - more resources