

Food price and diet and health outcomes: 20 years of the CARDIA Study
- PMID: 20212177
- PMCID: PMC3154748
- DOI: 10.1001/archinternmed.2009.545
Food price and diet and health outcomes: 20 years of the CARDIA Study
Erratum in
- Arch Intern Med. 2010 Jun 28;170(12):1089
Abstract
Background: Despite surging interest in taxation as a policy to address poor food choice, US research directly examining the association of food prices with individual intake is scarce.
Methods: This 20-year longitudinal study included 12 123 respondent days from 5115 participants in the Coronary Artery Risk Development in Young Adults (CARDIA) Study. Associations between food price, dietary intake, overall energy intake, weight, and homeostatic model assessment insulin resistance (HOMA-IR) scores were assessed using conditional log-log and linear regression models.
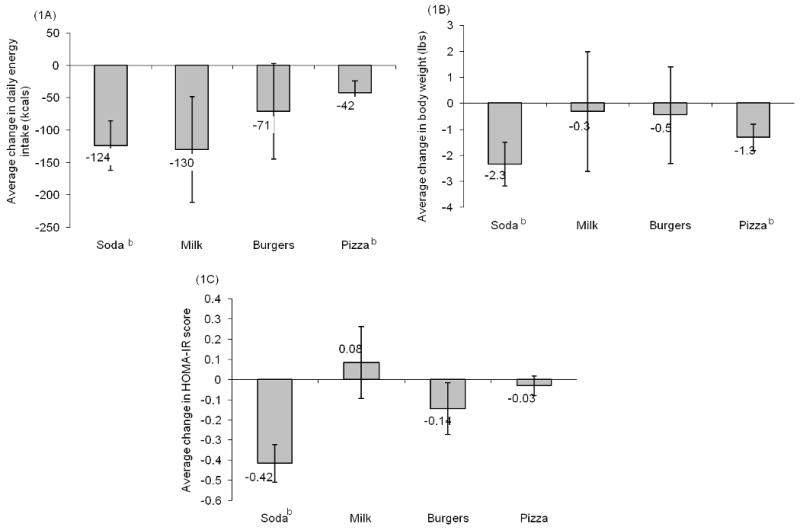
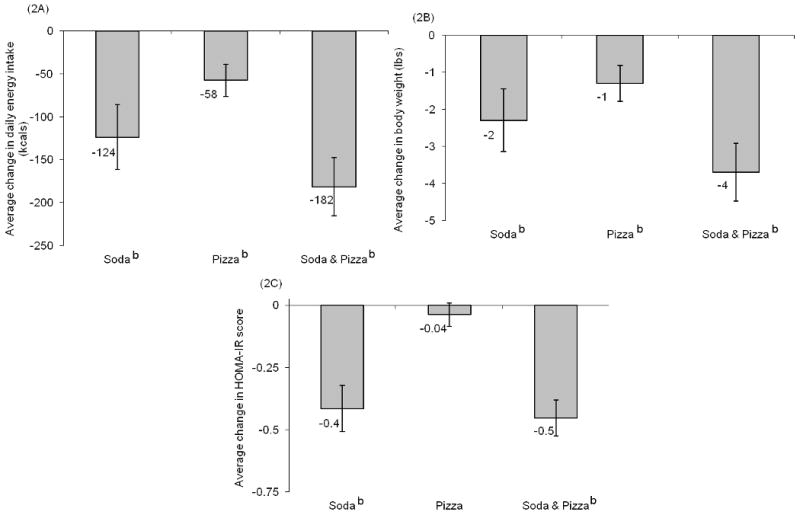
Results: The real price (inflated to 2006 US dollars) of soda and pizza decreased over time; the price of whole milk increased. A 10% increase in the price of soda or pizza was associated with a -7.12% (95% confidence interval [CI], -63.50 to -10.71) or -11.5% (95% CI, -17.50 to -5.50) change in energy from these foods, respectively. A $1.00 increase in soda price was also associated with lower daily energy intake (-124 [95% CI, -198 to -50] kcal), lower weight (-1.05 [95% CI, -1.80 to -0.31] kg), and lower HOMA-IR score (0.42 [95% CI, -0.60 to -0.23]); similar trends were observed for pizza. A $1.00 increase in the price of both soda and pizza was associated with greater changes in total energy intake (-181.49 [95% CI, -247.79 to -115.18] kcal), body weight (-1.65 [95% CI, -2.34 to 0.96] kg), and HOMA-IR (-0.45 [95% CI, -0.59 to -0.31]).
Conclusion: Policies aimed at altering the price of soda or away-from-home pizza may be effective mechanisms to steer US adults toward a more healthful diet and help reduce long-term weight gain or insulin levels over time.
Figures
Comment in
-
Food surcharges and subsidies: putting your money where your mouth is.Arch Intern Med. 2010 Mar 8;170(5):405-6. doi: 10.1001/archinternmed.2010.25. Arch Intern Med. 2010. PMID: 20212174 No abstract available.
References
-
- Cash S, Sunding D, Zilberman D. Fat taxes and thin subsidies: Prices, diet, and health outcomes. Acta Agriculturae Scandinavica, Section C - Economy. 2005;2(3-4):167–174. 168.
-
- Schroeter C, Lusk J, Tyner W. Determining the impact of food price and income changes on body weight. J Health Econ. 2008 January;27(1):45–68. - PubMed
-
- Finkelstein DM, Hill EL, Whitaker RC. School food environments and policies in US public schools. Pediatrics. 2008 Jul;122(1):e251–259. - PubMed
-
- Powell L, Chriqui J, Chaloupka F. Associations between State-level Soda Taxes and Adolescent Body Mass Index. Journal of Adolescent Health. 2009;45:S57–S63. - PubMed
-
- Fletcher JM, Frisvold DE, Tefft N. The Effects of Soft Drink Taxes on Child and Adolescent Consumption and Weight Outcomes. SSRN eLibrary. 2009
Publication types
MeSH terms
Grants and funding
- N01 HC095095/HL/NHLBI NIH HHS/United States
- N01-HC-48047/HC/NHLBI NIH HHS/United States
- N01 HC048049/HL/NHLBI NIH HHS/United States
- N01-HC-95095/HC/NHLBI NIH HHS/United States
- R01-AA12162/AA/NIAAA NIH HHS/United States
- N01-HC-48049/HC/NHLBI NIH HHS/United States
- R136EH000308-01/EH/NCEH CDC HHS/United States
- R01 CA109831/CA/NCI NIH HHS/United States
- DK056350/DK/NIDDK NIH HHS/United States
- K01-HD044263/HD/NICHD NIH HHS/United States
- P30 ES010126/ES/NIEHS NIH HHS/United States
- N01 HC048050/HC/NHLBI NIH HHS/United States
- R01-CA121152/CA/NCI NIH HHS/United States
- N01 HC048048/HL/NHLBI NIH HHS/United States
- N01 HC048047/HC/NHLBI NIH HHS/United States
- R01 CA121152/CA/NCI NIH HHS/United States
- N01 HC048048/HC/NHLBI NIH HHS/United States
- N01-HC-48050/HC/NHLBI NIH HHS/United States
- N01 HC095095/HC/NHLBI NIH HHS/United States
- R36 EH000308/EH/NCEH CDC HHS/United States
- N01 HC048049/HC/NHLBI NIH HHS/United States
- DK56350/DK/NIDDK NIH HHS/United States
- R01 AA012162/AA/NIAAA NIH HHS/United States
- N01 HC048047/HL/NHLBI NIH HHS/United States
- N01 HC048050/HL/NHLBI NIH HHS/United States
- K01 HD044263/HD/NICHD NIH HHS/United States
- P30 DK056350/DK/NIDDK NIH HHS/United States
- N01-HC-48048/HC/NHLBI NIH HHS/United States
- R24 HD050924/HD/NICHD NIH HHS/United States
- P30-ES10126/ES/NIEHS NIH HHS/United States
- R01-CA109831/CA/NCI NIH HHS/United States
LinkOut - more resources
Full Text Sources
Molecular Biology Databases
