Clinical Trial
. 2010 Mar;128(3):276-87.
doi: 10.1001/archophthalmol.2010.20.

Delaying treatment of ocular hypertension: the ocular hypertension treatment study

Affiliations
Clinical Trial

Delaying treatment of ocular hypertension: the ocular hypertension treatment study

Michael A Kass et al. Arch Ophthalmol. 2010 Mar.

Abstract

Objective: To compare the safety and efficacy of earlier vs later treatment in preventing primary open-angle glaucoma (POAG) in individuals with ocular hypertension.

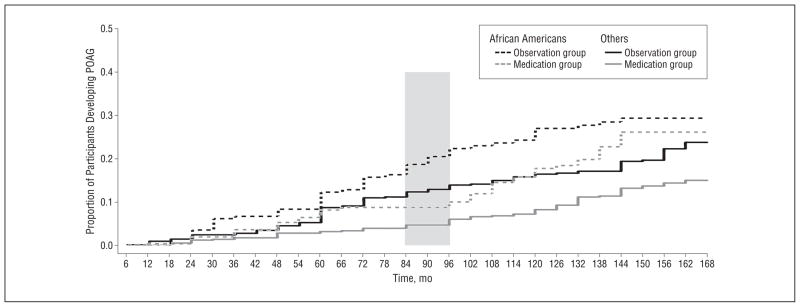
Methods: One thousand six hundred thirty-six individuals with intraocular pressure (IOP) from 24 to 32 mm Hg in 1 eye and 21 to 32 mm Hg in the fellow eye were randomized to observation or to topical ocular hypotensive medication. Median time of treatment in the medication group was 13.0 years. After a median of 7.5 years without treatment, the observation group received medication for a median of 5.5 years. To determine if there is a penalty for delaying treatment, we compared the cumulative proportions of participants who developed POAG at a median follow-up of 13 years in the original observation group and in the original medication group.

Main outcome measures: Cumulative proportion of participants who developed POAG.

Results: The cumulative proportion of participants in the original observation group who developed POAG at 13 years was 0.22 (95% confidence interval [CI], 0.19-0.25), vs 0.16 (95% CI, 0.13-0.19) in the original medication group (P = .009). Among participants at the highest third of baseline risk of developing POAG, the cumulative proportion who developed POAG was 0.40 (95% CI, 0.33-0.46) in the original observation group and 0.28 (95% CI, 0.22-0.34) in the original medication group. There was little evidence of increased adverse events associated with medication.

Application to clinical practice: Absolute reduction was greatest among participants at the highest baseline risk of developing POAG. Individuals at high risk of developing POAG may benefit from more frequent examinations and early preventive treatment.

Trial registration: clinicaltrials.gov Identifier: NCT00000125.


Figures

Figure 1
Figure 1
Flowchart of participant progress in the Ocular Hypertension Treatment Study (OHTS). POAG indicates primary open-angle glaucoma.
Figure 2
Figure 2
Distribution of intraocular pressure at each visit for the medication and observation groups. Topical ocular hypertension medication was initiated in the observation group at about the 84-month visit. The median intraocular pressure in each randomization group is joined by a line. The top and bottom of the boxes mark the 75th and 25th percentiles, respectively, and the error bars indicate the 90th and 10th percentiles. Each participant’s right and left eyes’ intraocular pressures were averaged to calculate a mean.
Figure 3
Figure 3
The percentage of participants in the medication (A) and observation (B) groups who were prescribed each class of medication at each follow-up visit. Percentages sum to greater than 100% because more than 1 class of medication may be prescribed. Combination drugs are counted twice. The shaded column indicates initiation of medication in the original observation group.
Figure 4
Figure 4
Survival plot of the cumulative probability of developing primary open-angle glaucoma (POAG) over the entire course of the study (February 1994 to March 2009) by randomization group. The number of participants at risk are those who have not developed POAG at the beginning of each 6-month period. Participants who did not develop POAG and withdrew before the end of the study are censored from their last completed visit. Participants who did not develop POAG and died are censored at their date of death. The shaded column indicates initiation of medication in the original observation group.
Figure 5
Figure 5
Survival plot of the cumulative probability of developing primary open-angle glaucoma (POAG) by randomization group and self-identified race. Participants who did not develop POAG and withdrew before the end of the study are censored from their last completed visit. Participants who did not develop POAG and died are censored at their date of death. The shaded column indicates initiation of medication in the original observation group.
Figure 6
Figure 6
Distribution of baseline 5-year risk of developing primary open-angle glaucoma (POAG) by self-identified race.
Figure 7
Figure 7
Survival plot of the cumulative probability of developing primary open-angle glaucoma (POAG) during the entire course of the study by randomization group for participants with the lowest tertile (<6.0) (A), middle tertile (6.0%–13%) (B), and highest tertile (>13%) (C) of baseline predicted 5-year risk of POAG. Participants who did not develop POAG and withdrew before the end of the study are censored from the interval of their last completed visit. Participants who did not develop POAG and died are censored at their date of death. The shaded column indicates initiation of medication in the original observation group.
Figure 8
Figure 8
Unadjusted means for pattern standard deviation (A) and mean deviation (B) over time. Time 0 is the onset of primary open-angle glaucoma (POAG) for participants with POAG or 7 years’ postrandomization for participants who did not develop POAG.

Comment in

References

    1. Quigley HA. Number of people with glaucoma worldwide. Br J Ophthalmol. 1996;80(5):389–393. - PMC - PubMed
    1. Sommer A, Tielsch JM, Katz J, et al. Racial differences in the cause-specific prevalence of blindness in east Baltimore. N Engl J Med. 1991;325(20):1412–1417. - PubMed
    1. US Department of Health. Education, and Welfare. Statistics on blindness in the model reporting area 1969–1970. Washington, DC: US Government Printing Office; 1973.
    1. Quigley HA, Vitale S. Models of open-angle glaucoma prevalence and incidence in the United States. Invest Ophthalmol Vis Sci. 1997;38(1):83–91. - PubMed
    1. Hyman L, Wu SY, Connell AM, et al. Prevalence and causes of visual impairment in the Barbados Eye Study. Ophthalmology. 2001;108(10):1751–1756. - PubMed

Publication types

Substances

Associated data