

Comparison of error rates in single-arm versus randomized phase II cancer clinical trials
- PMID: 20212253
- PMCID: PMC2860370
- DOI: 10.1200/JCO.2009.25.5489
Comparison of error rates in single-arm versus randomized phase II cancer clinical trials
Abstract
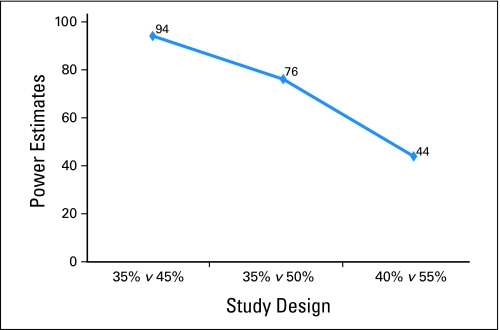
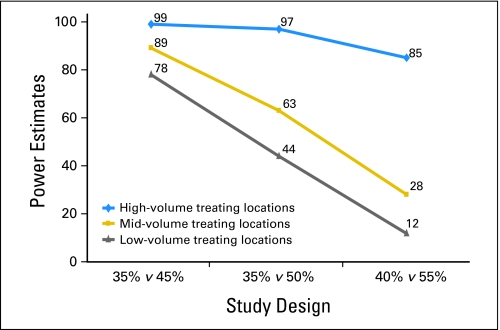
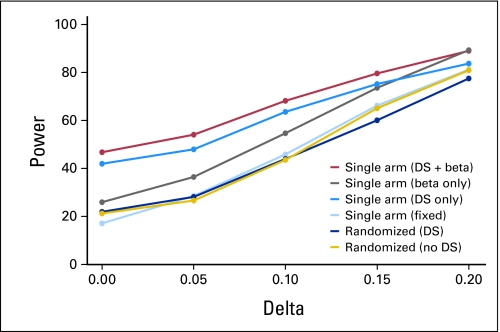
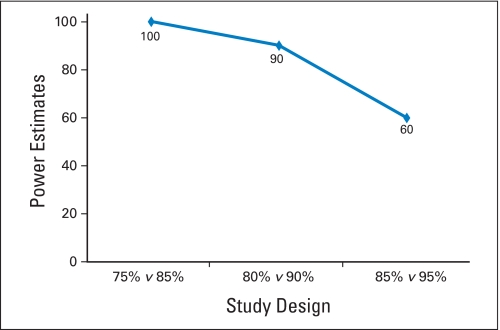
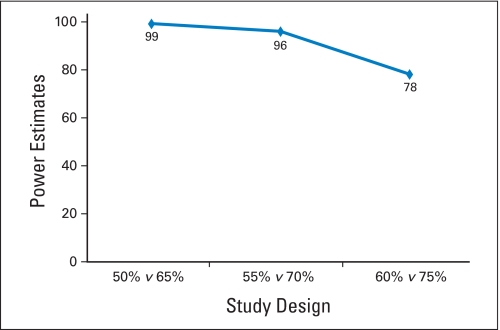
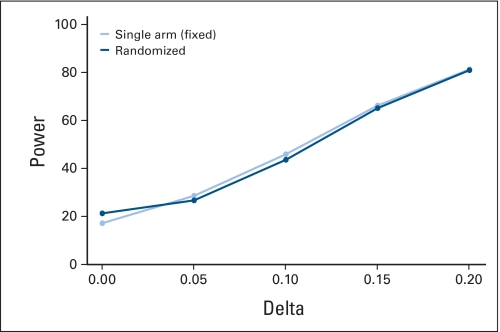
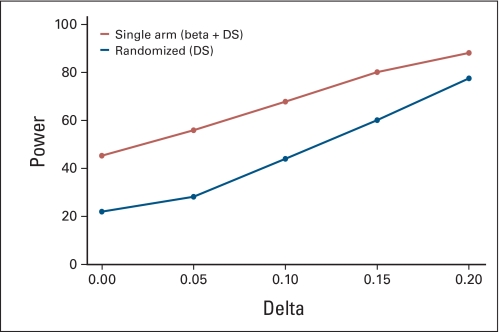
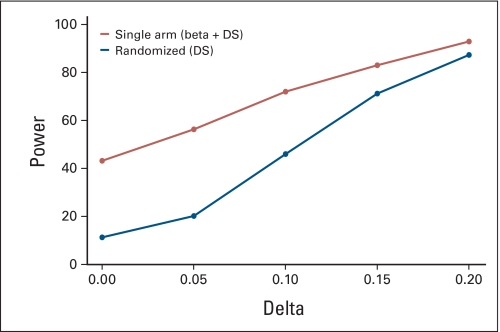
PURPOSE To improve the understanding of the appropriate design of phase II oncology clinical trials, we compared error rates in single-arm, historically controlled and randomized, concurrently controlled designs. PATIENTS AND METHODS We simulated error rates of both designs separately from individual patient data from a large colorectal cancer phase III trials and statistical models, which take into account random and systematic variation in historical control data. RESULTS In single-arm trials, false-positive error rates (type I error) were 2 to 4 times those projected when modest drift or patient selection effects (eg, 5% absolute shift in control response rate) were included in statistical models. The power of single-arm designs simulated using actual data was highly sensitive to the fraction of patients from treatment centers with high versus low patient volumes, the presence of patient selection effects or temporal drift in response rates, and random small-sample variation in historical controls. Increasing sample size did not correct the over optimism of single-arm studies. Randomized two-arm design conformed to planned error rates. CONCLUSION Variability in historical control success rates, outcome drifts in patient populations over time, and/or patient selection effects can result in inaccurate false-positive and false-negative error rates in single-arm designs, but leave performance of the randomized two-arm design largely unaffected at the cost of 2 to 4 times the sample size compared with single-arm designs. Given a large enough patient pool, the randomized phase II designs provide a more accurate decision for screening agents before phase III testing.
Conflict of interest statement
Authors' disclosures of potential conflicts of interest and author contributions are found at the end of this article.
Figures
References
-
- Simon R. Optimal two-stage designs for phase II clinical trials. Control Clin Trials. 1989;10:1–10. - PubMed
-
- Green SJ, Dahlberg S. Planned versus attained design in phase II clinical trials. Stat Med. 1992;11:853–862. - PubMed
-
- Chalmers TC. When should randomisation begin? Lancet. 1968;291:858. - PubMed
-
- Senn S. Statistical Issues in Drug Development. ed 2. Malden, MA: Wiley-Interscience; 2008.
-
- Kindler HL, Friberg G, Singh DA, et al. Phase II trial of bevacizumab plus gemcitabine in patients with advanced pancreatic cancer. J Clin Oncol. 2005;23:8033–8040. - PubMed
Publication types
MeSH terms
Substances
Grants and funding
LinkOut - more resources
Full Text Sources
Medical
