. 2010:6:352.
doi: 10.1038/msb.2010.6. Epub 2010 Mar 9.

Dynamics within the CD95 death-inducing signaling complex decide life and death of cells

Affiliations

Dynamics within the CD95 death-inducing signaling complex decide life and death of cells

Leo Neumann et al. Mol Syst Biol. 2010.

Abstract

This study explores the dilemma in cellular signaling that triggering of CD95 (Fas/APO-1) in some situations results in cell death and in others leads to the activation of NF-kappaB. We established an integrated kinetic mathematical model for CD95-mediated apoptotic and NF-kappaB signaling. Systematic model reduction resulted in a surprisingly simple model well approximating experimentally observed dynamics. The model postulates a new link between c-FLIP(L) cleavage in the death-inducing signaling complex (DISC) and the NF-kappaB pathway. We validated experimentally that CD95 stimulation resulted in an interaction of p43-FLIP with the IKK complex followed by its activation. Furthermore, we showed that the apoptotic and NF-kappaB pathways diverge already at the DISC. Model and experimental analysis of DISC formation showed that a subtle balance of c-FLIP(L) and procaspase-8 determines life/death decisions in a nonlinear manner. We present an integrated model describing the complex dynamics of CD95-mediated apoptosis and NF-kappaB signaling.


Conflict of interest statement

The authors declare that they have no conflict of interest.

Figures

Figure 1
Figure 1
NF-κB and caspases show parallel activation. (AC) HeLa-CD95 cells were stimulated with (A)1500 ng/ml, (B) 500 ng/ml and (C) 250 ng/ml of agonistic anti-CD95 antibodies for the indicated periods of time. The cellular lysates were analyzed by western blotting using antibodies against caspases, IκBα and p-IκBα. Nonspecific bands of anti-p-IκBα are marked (NS). Results are representative of four different experiments. (D) To follow p65 localization, Hela-CD95 cells were stably transfected with p65–mCherry. Cells were stimulated with 1500 ng/ml anti-CD95 antibody and imaged using fluorescent microscopy over the respective time. Measurements of mCherry (depicted in gray) indicated translocation of p65 on CD95 activation. Induced apoptosis is observed by the appearance of apoptotic bodies. Scale bar: 10 μm.
Figure 2
Figure 2
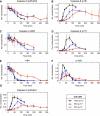
Quantified response to anti-CD95 stimulation. Each of the panels (AG) shows a quantification of western blots shown in Figure 1A–C. The symbols mark the average value and the lines show their linear interpolations. The s.d. was included when more than one value was obtained. Black, blue and red colors correspond to 1500, 500 and 250 ng/ml anti-CD95 antibodies, respectively, used to induce the cells at time t=0.
Figure 3
Figure 3
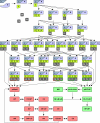
Model of CD95-mediated signaling. A graphic representation of the complete model illustrating the process of DISC formation and subsequent signaling of the apoptotic (depicted in red) and NF-κB pathway (depicted in green). Abbreviations: L, CD95 ligand; R, CD95 receptor; F, FADD; C8, procaspase-8 (p55/p53); C8*, active caspase-8; C3, procaspase-3; C3*, active caspase-3; C6, procaspase-6; C6*, active caspase-6; FL, c-FLIPL; FS, c-FLIPS; X, C8, FL or FS; p43/p41, 1st cleavage product of procaspase-8; and p43-FLIP, cleavage product of c-FLIPL.
Figure 4
Figure 4
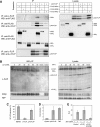
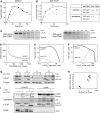
p43-FLIP interacts with the IKK complex on CD95 stimulation. (A) The association of p43-FLIP with components of the IKK complex was determined using co-immunoprecipitations (IPs). 293T cells were co-transfected with FLAG-tagged IKKα, IKKβ or IKKγ with or without p43-FLIP. The lysates were immunoprecipitated using antibodies against the FLAG tag or against c-FLIP and analyzed by western blotting using antibodies against the FLAG tag or c-FLIP (left side). In parallel, corresponding lysates were also analyzed using western blot analysis with the same antibodies as the immunoprecipitation (right side). (B) The association of p43-FLIP with the IKK complex under endogenous conditions was determined using co-immunoprecipitations of IKKγ (IKKγ-IP). HeLa-CD95 cells were stimulated with 500 ng/ml of LZ-CD95L for the indicated time intervals and immunoprecipitated using an antibody against IKKγ. All subunits of the IKK complex were immunoprecipitated in this procedure due to IKK complex stability. The immunoprecipitated proteins (IKKγ-IP, left side) and the corresponding lysates (lysate, right side) were analyzed by western blotting using antibodies against c-FLIP, IKKβ and RIP. IKKβ served as a loading control. (C) 0.5 × 10⁵ 293T cells were co-transfected with MEKK1, p43-FLIP and c-FLIPL, and the luciferase reporter plasmid. NF-κB–luciferase activity was determined at 16 h after transfection. The results represent the mean±s.d. values of quadruplet cultures. GFP transfection was performed to control 100% transfection efficiency. (D) 1 × 10⁵ HeLa-CD95 cells were transfected with a NF-κB-dependent luciferase reporter plasmid (1 μg per well) and a Renilla reporter plasmid (100 ng per well). Cells were either untreated (control), co-transfected with p43-FLIP (2 μg per well) or stimulated with TNF (500 ng/ml). NF-κB–luciferase activity was determined at 16 h after transfection. Renilla transfection was performed to normalize the transfection efficiency. (E) 1 × 10⁵ HeLa-CD95 cells were co-transfected with a luciferase (1 μg per well) and a Renilla reporter plasmid (100 ng per well), as well as pcDNA3 as a control plasmid (control), WT c-FLIPL or c-FLIPL (D376E; 2 μg per well). At 24 h after transfection, cells were left untreated or were stimulated with 1000 ng/ml of anti-CD95. To prevent apoptosis cells were pretreated with 20 μM zVAD-fmk at 30 min before CD95 stimulation. NF-κB–luciferase activity was determined at 16 h after CD95 stimulation. Renilla transfection was performed to normalize the transfection efficiency.
Figure 5
Figure 5
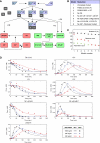
Reduced model is sufficient to explain dynamics of life/death signaling. (A) Reduced model of CD95-mediated caspase and NF-κB activation. CD95 receptor and FADD are merged into one entity named RF. (B) The table lists the consecutive reduction steps performed from models 1 to 8. (C) Model comparison using the relative goodness of fit, in which the χ2 measure of model 1 is set to 100%. Red diamonds indicate the number of reactions of each model and squares show the corresponding number of parameters. (D) Simulated concentrations of proteins in HeLa-CD95 cells based on the reduced model after receptor stimulation. Black, blue and red colors correspond to 1500, 500 and 250 ng/ml anti-CD95, respectively, used to induce the cells at time t=0. C8 (sum) is observable, which sums all concentrations of proteins containing one copy of procaspase-8, for example, L·RF·C8·FS. Squares, diamonds and triangles indicate experimental data obtained by western blot (cf. Figure 2).
Figure 6
Figure 6
Life/death threshold concentration is independent of the amount of CD95. (A) The simulated dose–response curves display active NF-κB and caspase-8 as a function of the simulation strength for HeLa cells (light gray) and HeLa-CD95 cells (dark gray). The highest concentrations attained by NF-κB* and C8* in a simulation of 60 h for a given stimulus are shown. Concentrations were scaled to unity for comparison. Vertical dotted black lines indicate the used experimental concentrations of anti-CD95 antibody (1500/500/250 ng/ml; cf. Figure 1). (B) HeLa-CD95 and WT HeLa cells were stimulated with various amounts of anti-CD95 antibodies for 18 h. Cell death was determined by flow cytometry. (C) Western blot analysis of CD95 expression in HeLa-CD95 cells. GFP-tagged CD95 and endogenous CD95 are indicated. Glycosylation of CD95 gave rise to multiple bands in the range of 42–52 kDa for endogenous CD95 and 59–69 kDa for GFP-tagged CD95. (D) HeLa and HeLa-CD95 cells were stimulated using 500 ng/ml of anti-CD95 antibodies for the indicated time intervals. Total cellular lysates were analyzed by western blotting using antibodies against caspase-8, IκBα and tubulin (loading control).
Figure 7
Figure 7
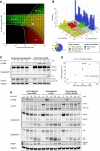
c-FLIPL recruitment kinetics explains the differential dynamics of the two pathways. (A) Simulation and experimental data of p43/p41 dynamics for 1500 and 500 ng/ml of stimulating anti-CD95 antibody. (B) Same as (A) for p43-FLIP. The data points were obtained by quantifying the blots shown in (C). (C) HeLa-CD95 cells stimulated with 1500/500 ng/ml anti-CD95 for the indicated time points. Lysates were used for western blots analysis using an antibody against c-FLIP. The full-length form of c-FLIPL and its cleavage product p43-FLIP are indicated. (D) The curves show the time when p43/p41 and p43-FLIP reached their peak level in the simulation as a function of the antibody concentration. (E) Model prediction of the maximal concentration of p43/p41 and p43-FLIP depending on the initial concentration of c-FLIPS. The dotted line indicates the estimated level of c-FLIPS in our setting. Stimulation intensity corresponds to 1000 ng/ml of anti-CD95 antibodies. (F) Same as in (E) but with c-FLIPL. (G) Western blotting of four different clones of HeLa-CD95 cells stably overexpressing c-FLIPL in different amounts. Western blots show the full-length form of c-FLIPL and its cleavage product p43-FLIP after induction with 1000 ng/ml of anti-CD95 for the indicated time points. Tubulin serves as a loading control. (H) Quantification of (G) by plotting the intensity of c-FLIPL at 0 min against p43-FLIP at 30 min. For normalization, the amounts of c-FLIPL and p43-FLIP in clone C were set to 1, as they exhibited the lowest levels. (I) HeLa-CD95 cells with a stable c-FLIP downregulation (c-FLIP−) and control-transfected HeLa-CD95 cells (c-FLIP+) were generated by RNA interference. The cells were kept under nonstimulated conditions for control (anti-CD95−) or stimulated with 500 ng/ml anti-CD95 for 30 min (anti-CD95+). The CD95-IP was performed using anti-CD95 antibodies. The immunoprecipitated proteins (CD95-IP) and the lysates were analyzed by western blot using antibodies against caspase-8, c-FLIP and CD95. Secondary antibodies recognize the heavy chain (50 kDa) of the antibody used for the IPs. Thus, the heavy chain of the antibody used for immunoprecipitation is marked in the western blot with an asteric (*=IgGH). Importantly, the amount of antibody in the unstimulated lane was always higher as it was added after cell lysis.
Figure 8
Figure 8
DISC protein stoichiometry is determinant of cell fate. (A) This model-based prediction illustrates how different levels of procaspase-8 and c-FLIPL may lead to different phenotypes. The logarithm of the maximum concentration of active NF-κB (green) and caspase-3 (red) in a simulation of 6 h after CD95 stimulation is shown as a function of the initial concentration of procaspase-8 and c-FLIPL. Dotted lines were drawn manually to delineate different regimes of activation. The blue circle indicates the estimated level of c-FLIPL and procaspase-8 in HeLa-CD95 cells. (B) Sensitivity analysis. Absolute values of relative sensitivities were averaged over a time interval of 360 min. The pie chart shows the contribution of different parameter categories to the total sensitivity. For variable and parameter numbers see Supplementary Tables S1 and S2. (C) HeLa-CD95 cells stably downregulating procaspase-8 were generated by RNA interference and compared against control HeLa-CD95 cells. Both cell lines were stimulated with 500 ng/ml anti-CD95 for the indicated time intervals. The lysates were used for western blot analysis against caspase-8, p-IκBα, c-FLIP and tubulin. (D) Cell death assay of HeLa-CD95 cells with c-FLIPL overexpression. Specific apoptosis normalized to 100% for HeLa-CD95 cells (control) is shown. Cells were treated with the depicted amount of anti-CD95 for 18 h. Cell death was determined with PI staining and analyzed with flow cytometry. Specific cell death was calculated as described in Materials and methods section. (E) c-FLIP-deficient HeLa-CD95 cells were transiently transfected with WT c-FLIPL (middle) or c-FLIPL (D376E; right; 15 ng per well). At 24 h after transfection, cells were stimulated with 1000 ng/ml anti-CD95 for the indicated time intervals. The lysates were used for western blot analysis against p-IκBα, c-FLIP, caspase-8, caspase-3, PARP and tubulin.

Similar articles

Cited by

References

    1. Arnold R, Liou J, Drexler HC, Weiss A, Kiefer F (2001) Caspase-mediated cleavage of hematopoietic progenitor kinase 1 (HPK1) converts an activator of NFkappaB into an inhibitor of NFkappaB. J Biol Chem 276: 14675–14684 - PubMed
    1. Ashkenazi A, Dixit VM (1998) Death receptors: signaling and modulation. Science 281: 1305–1308 - PubMed
    1. Bagci EZ, Vodovotz Y, Billiar TR, Ermentrout GB, Bahar I (2006) Bistability in apoptosis: roles of Bax, Bcl-2, and mitochondrial permeability transition pores. Biophys J 90: 1546–1559 - PMC - PubMed
    1. Barnhart BC, Legembre P, Pietras E, Bubici C, Franzoso G, Peter ME (2004) CD95 ligand induces motility and invasiveness of apoptosis-resistant tumor cells. EMBO J 23: 3175–3185 - PMC - PubMed
    1. Bentele M, Lavrik I, Ulrich M, Stosser S, Heermann DW, Kalthoff H, Krammer PH, Eils R (2004) Mathematical modeling reveals threshold mechanism in CD95-induced apoptosis. J Cell Biol 166: 839–851 - PMC - PubMed

Publication types