Abelson virus transformation prevents TRAIL expression by inhibiting FoxO3a and NF-kappaB
- PMID: 20213318
- PMCID: PMC2862835
- DOI: 10.1007/s10059-010-0029-8
Abelson virus transformation prevents TRAIL expression by inhibiting FoxO3a and NF-kappaB
Abstract
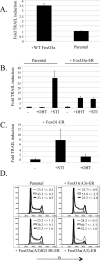
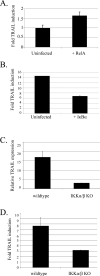
The Abelson Murine Leukemia Virus (A-MuLV) encodes v-Abl, an oncogenic form of the ubiquitous cellular non-receptor tyrosine kinase, c-Abl. A-MuLV specifically transforms murine B cell precursors both in vivo and in vitro. Inhibition of v-Abl by addition of the small molecule inhibitor STI-571 causes these cells to arrest in the G1 phase of the cell cycle prior to undergoing apoptosis. We found that inhibition of v-Abl activity results in upregulation of transcription of the pro-apoptotic TNF-family ligand tumor-necrosis factor-related apoptosis-inducing ligand (TRAIL). Similarly to BCR-Abl-transformed human cells, activation of the transcription factor Foxo3a led to increased TRAIL transcription and induction of a G1 arrest in the absence of v-Abl inhibition, and this effect could be inhibited by the expression of a constitutively active AKT mutant. Multiple pathways act to inhibit FoxO3a activity within Abelson cells. In addition to diminishing transcription factor activity via inhibitory phosphorylation by AKT family members, we found that inhibition of IKKbeta activity results in an increase in the total protein level of FoxO3a. Furthermore overexpression of the p65 subunit of NF-kappaB results in an increase in TRAIL transcription and in apoptosis and deletion of IKKalpha and beta diminishes TRAIL expression and induction. We conclude that in Abelson cells, the inhibition of both NF-kappaB and FoxO3a activity is required for suppression of TRAIL transcription and maintenance of the transformed state.
Figures


Similar articles
-
Active FKHRL1 overcomes imatinib resistance in chronic myelogenous leukemia-derived cell lines via the production of tumor necrosis factor-related apoptosis-inducing ligand.Cancer Sci. 2007 Dec;98(12):1949-58. doi: 10.1111/j.1349-7006.2007.00623.x. Epub 2007 Sep 26. Cancer Sci. 2007. PMID: 17900262 Free PMC article.
-
STI571 reduces TRAIL-induced apoptosis in colon cancer cells: c-Abl activation by the death receptor leads to stress kinase-dependent cell death.J Biomed Sci. 2012 Mar 30;19(1):35. doi: 10.1186/1423-0127-19-35. J Biomed Sci. 2012. PMID: 22462553 Free PMC article.
-
TGF-beta-FOXO signalling maintains leukaemia-initiating cells in chronic myeloid leukaemia.Nature. 2010 Feb 4;463(7281):676-80. doi: 10.1038/nature08734. Nature. 2010. PMID: 20130650
-
Pristimerin induces apoptosis in imatinib-resistant chronic myelogenous leukemia cells harboring T315I mutation by blocking NF-kappaB signaling and depleting Bcr-Abl.Mol Cancer. 2010 May 19;9:112. doi: 10.1186/1476-4598-9-112. Mol Cancer. 2010. PMID: 20482842 Free PMC article.
-
FoxO tumor suppressors and BCR-ABL-induced leukemia: a matter of evasion of apoptosis.Biochim Biophys Acta. 2008 Jan;1785(1):63-84. doi: 10.1016/j.bbcan.2007.10.003. Epub 2007 Oct 16. Biochim Biophys Acta. 2008. PMID: 17980712 Free PMC article. Review.
Cited by
-
IN-DEPTH MAPPING OF DNA-PKcs SIGNALING UNCOVERS CONSERVED FEATURES OF ITS KINASE SPECIFICITY.bioRxiv [Preprint]. 2024 Jan 19:2024.01.17.576037. doi: 10.1101/2024.01.17.576037. bioRxiv. 2024. Update in: J Biol Chem. 2024 Aug;300(8):107513. doi: 10.1016/j.jbc.2024.107513. PMID: 38293078 Free PMC article. Updated. Preprint.
-
PPARγ and Oxidative Stress: Con(β) Catenating NRF2 and FOXO.PPAR Res. 2012;2012:641087. doi: 10.1155/2012/641087. Epub 2012 Mar 5. PPAR Res. 2012. PMID: 22481913 Free PMC article.
-
FOXO3a-interacting proteins' involvement in cancer: a review.Mol Biol Rep. 2024 Jan 25;51(1):196. doi: 10.1007/s11033-023-09121-w. Mol Biol Rep. 2024. PMID: 38270719 Review.
-
Radiofrequency EMF irradiation effects on pre-B lymphocytes undergoing somatic recombination.Sci Rep. 2021 Jun 16;11(1):12651. doi: 10.1038/s41598-021-91790-3. Sci Rep. 2021. PMID: 34135382 Free PMC article.
-
FoxO3a and disease progression.World J Biol Chem. 2014 Aug 26;5(3):346-54. doi: 10.4331/wjbc.v5.i3.346. World J Biol Chem. 2014. PMID: 25225602 Free PMC article. Review.
References
-
- Abelson HT, Rabstein LS. Lymphosarcoma: virus-induced thymic-independent disease in mice. Cancer Res. 1970;30:2213–2222. - PubMed
-
- Advani AS, Pendergast AM. Bcr-Abl variants: biological and clinical aspects. Leuk Res. 2002;26:713–720. - PubMed
-
- Baetu TM, Kwon H, Sharma S, Grandvaux N, Hiscott J. Disruption of NF-kappaB signaling reveals a novel role for NF-kappaB in the regulation of TNF-related apoptosis-inducing ligand expression. J Immunol. 2001;167:3164–3173. - PubMed
Publication types
MeSH terms
Substances
Grants and funding
LinkOut - more resources
Full Text Sources
Research Materials
Miscellaneous

