

Mayday--integrative analytics for expression data
- PMID: 20214778
- PMCID: PMC2848234
- DOI: 10.1186/1471-2105-11-121
Mayday--integrative analytics for expression data
Abstract
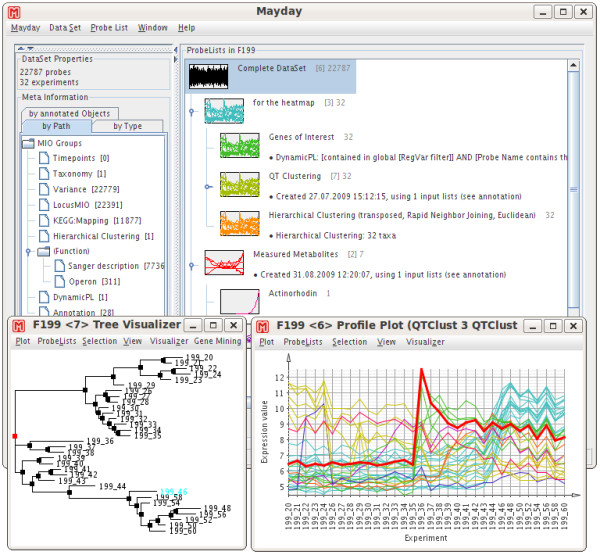
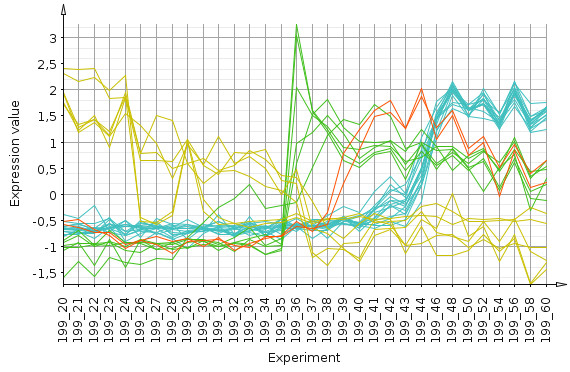
Background: DNA Microarrays have become the standard method for large scale analyses of gene expression and epigenomics. The increasing complexity and inherent noisiness of the generated data makes visual data exploration ever more important. Fast deployment of new methods as well as a combination of predefined, easy to apply methods with programmer's access to the data are important requirements for any analysis framework. Mayday is an open source platform with emphasis on visual data exploration and analysis. Many built-in methods for clustering, machine learning and classification are provided for dissecting complex datasets. Plugins can easily be written to extend Mayday's functionality in a large number of ways. As Java program, Mayday is platform-independent and can be used as Java WebStart application without any installation. Mayday can import data from several file formats, database connectivity is included for efficient data organization. Numerous interactive visualization tools, including box plots, profile plots, principal component plots and a heatmap are available, can be enhanced with metadata and exported as publication quality vector files.
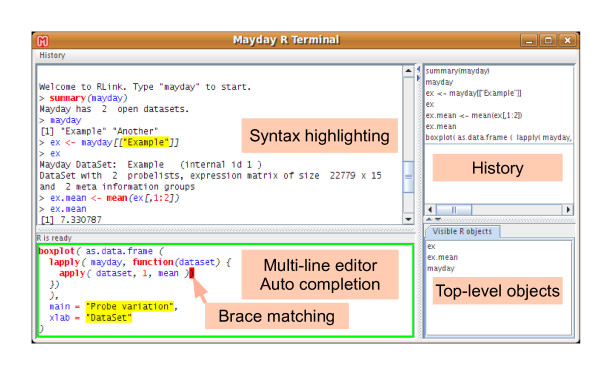
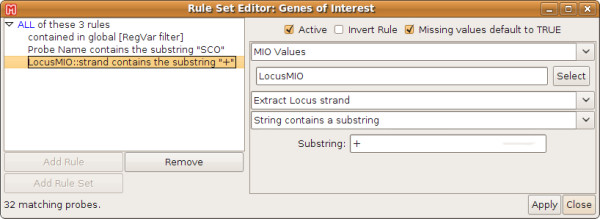
Results: We have rewritten large parts of Mayday's core to make it more efficient and ready for future developments. Among the large number of new plugins are an automated processing framework, dynamic filtering, new and efficient clustering methods, a machine learning module and database connectivity. Extensive manual data analysis can be done using an inbuilt R terminal and an integrated SQL querying interface. Our visualization framework has become more powerful, new plot types have been added and existing plots improved.
Conclusions: We present a major extension of Mayday, a very versatile open-source framework for efficient micro array data analysis designed for biologists and bioinformaticians. Most everyday tasks are already covered. The large number of available plugins as well as the extension possibilities using compiled plugins and ad-hoc scripting allow for the rapid adaption of Mayday also to very specialized data exploration. Mayday is available at http://microarray-analysis.org.
Figures


References
-
- Dondrup M, Albaum SP, Griebel T, Henckel K, Jünemann S, Kahlke T, Kleindt CK, Küster H, Linke B, Mertens D, Mittard-Runte V, Neuweger H, Runte KJ, Tauch A, Tille F, Pühler A, Goesmann A. EMMA 2-a MAGE-compliant system for the collaborative analysis and integration of microarray data. BMC Bioinformatics. 2009;10:50. doi: 10.1186/1471-2105-10-50. - DOI - PMC - PubMed
-
- Tarraga J, Medina I, Carbonell J, Huerta-Cepas J, Minguez P, Alloza E, Al-Shahrour F, Vegas-Azcarate S, Goetz S, Escobar P, Garcia-Garcia F, Conesa A, Montaner D, Dopazo J. GEPAS, a web-based tool for microarray data analysis and interpretation. Nucleic Acids Res. 2008. pp. W308–W314. - DOI - PMC - PubMed
-
- Gehlenborg N, Dietzsch J, Nieselt K. A Framework for Visualization of Microarray Data and Integrated Meta Information. Information Visualization. 2005;4:164–175. doi: 10.1057/palgrave.ivs.9500094. - DOI
Publication types
MeSH terms
LinkOut - more resources
Full Text Sources
Other Literature Sources
