. 2010 Mar 9:9:54.
doi: 10.1186/1476-4598-9-54.

The AP-1 repressor protein, JDP2, potentiates hepatocellular carcinoma in mice

Affiliations

The AP-1 repressor protein, JDP2, potentiates hepatocellular carcinoma in mice

Keren Bitton-Worms et al. Mol Cancer. .

Abstract

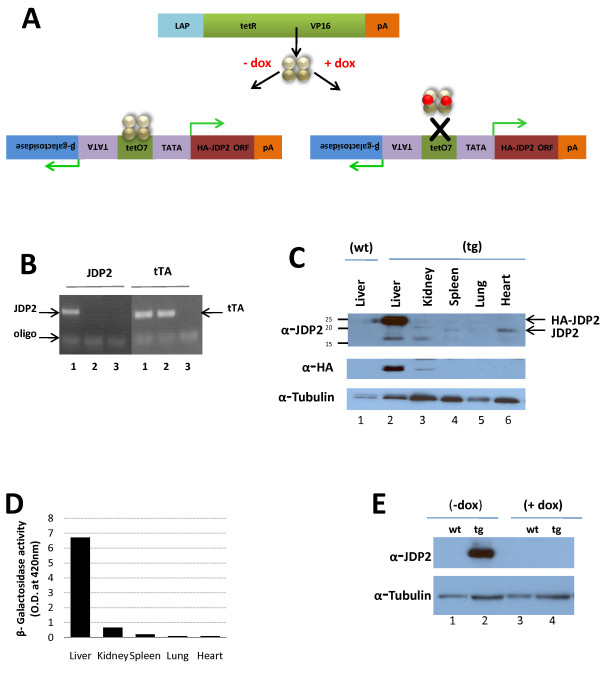
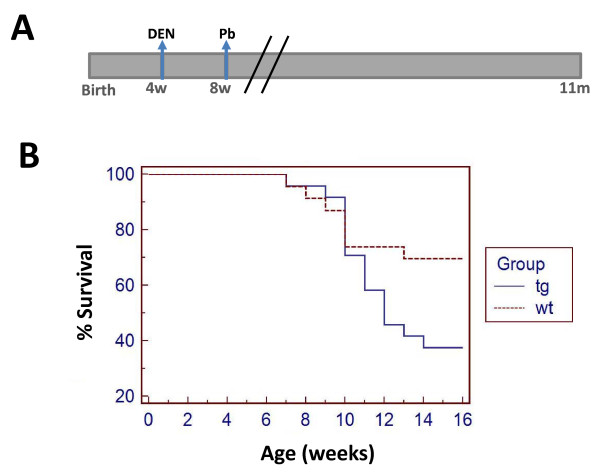
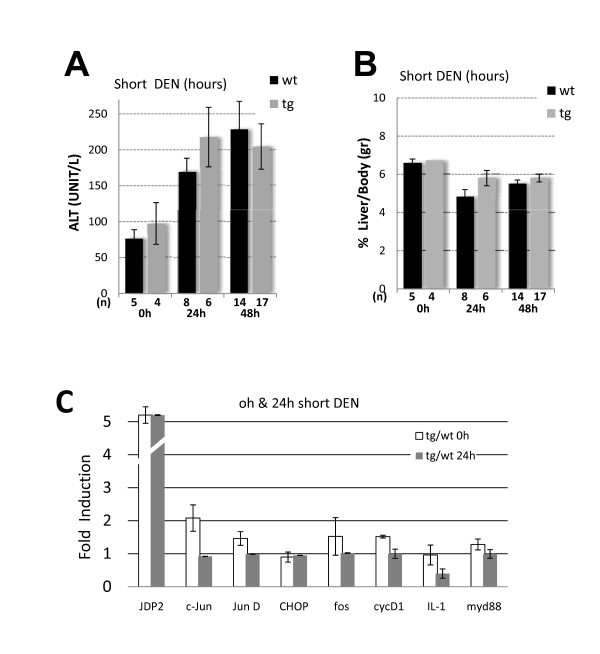
Background: The AP-1 transcription factor plays a major role in cell proliferation, apoptosis, differentiation and developmental processes. AP-1 proteins are primarily considered to be oncogenic. Gene disruption studies placed c-Jun as an oncogene at the early stage of a mouse model of hepatocellular carcinoma. Mice lacking c-Jun display reduced number and size of hepatic tumors attributed to elevated p53 expression and increased apoptosis. This suggests that c-Jun inhibition may serve as a therapeutic target for liver cancer. The c-Jun dimerization protein 2, JDP2 is an AP-1 repressor protein that potently inhibits AP-1 transcription. On the other hand, the JDP2 locus was found at a recurring viral integration site in T-cell lymphoma. We sought to examine the potential of JDP2 to inhibit c-Jun/AP-1 oncogenic activity in mice. Towards this end, we generated a tetracycline inducible transgenic mouse expressing JDP2 specifically in the liver. We used diethylnitrosamine (DEN) injection to initiate liver cancer in mice and assessed the extent of liver cancer in JDP2-transgenic and wild type control mice by biochemical and molecular biology techniques.

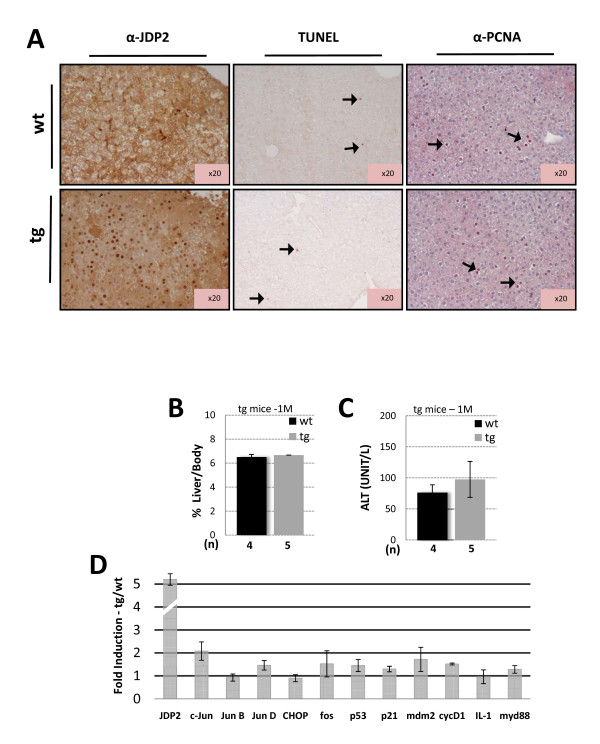
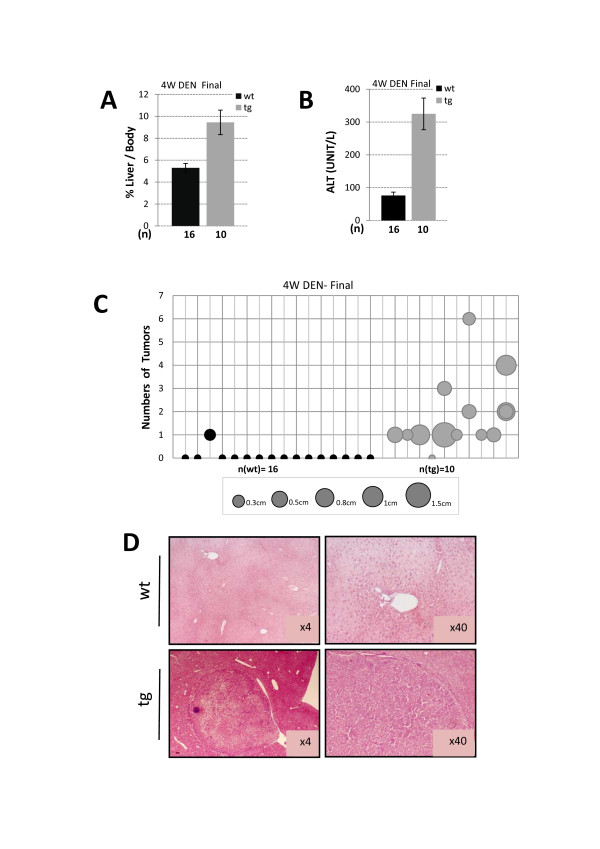
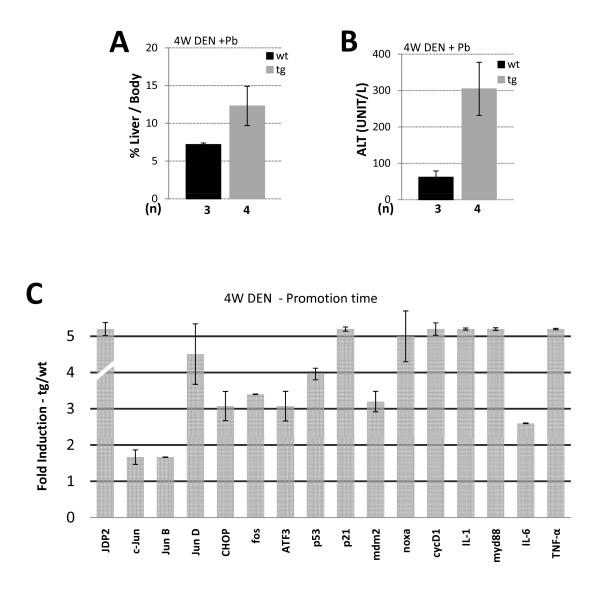
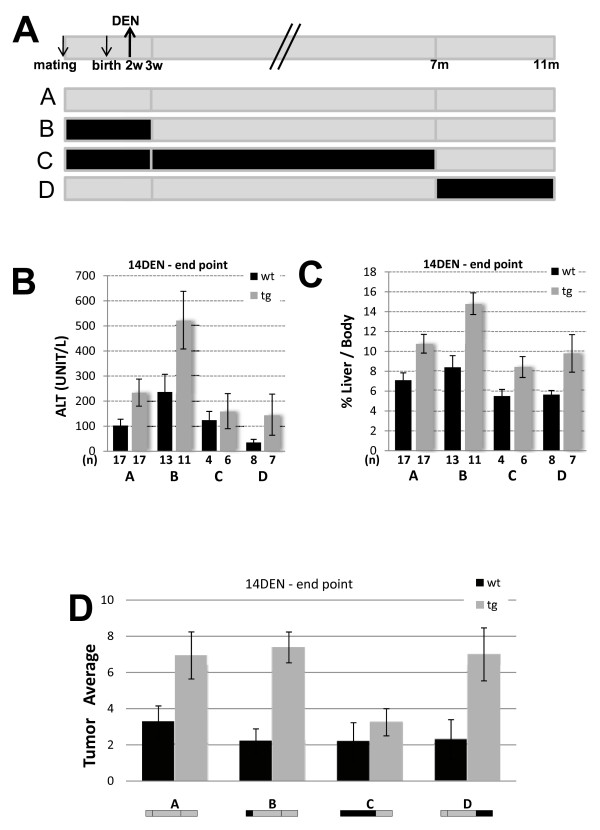
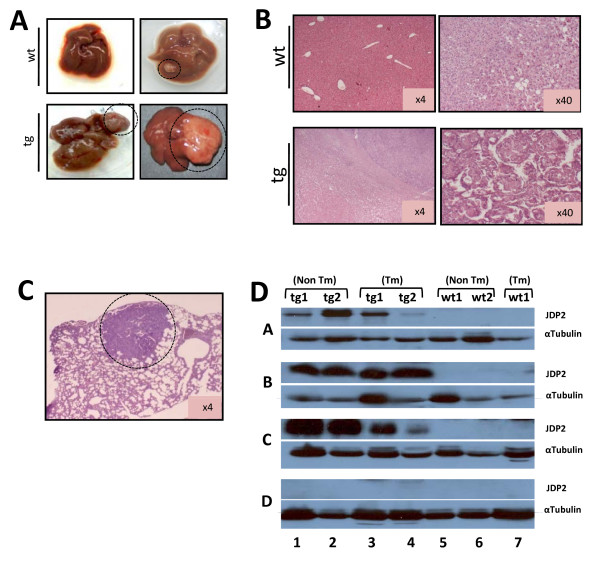
Results: JDP2-transgenic mice display normal liver function. JDP2-transgenic mice displayed potentiation of liver cancer, higher mortality and increased number and size of tumors. The expression of JDP2 at the promotion stage was found to be the most critical for enhancing liver cancer severity.

Conclusions: This study suggests that JDP2 expression may play a critical role in liver cancer development by potentiating the compensatory proliferative response and increased inflammation in the DEN liver cancer model.


Figures

Figure 1
Figure 1
Liver specific expression of JDP2 in JDP2-transgenic and control mice. A. HA-JDP2 expressing mice responder line was generated in the pBIG bi-cistronic expression plasmid under the regulation of tetracycline response elements. The promoter co-regulates the expression of the β-galactosidase reporter together with HA-JDP2 protein. tTA-responder mice express the tetracycline activator (tTA) under the control of Liver Activating Protein promoter (LAP). tTA is expressed specifically in hepatocytes. The association of the tTA with the DNA is prevented in the presence of doxycycline thus results in shut-off transgene expression. B. Mouse tail genotyping by PCR was performed with specific oligonucleotides corresponding to the tTA driver (tTA, right panel) and JDP2-transgene (JDP2, left panel). DNA derived from either double transgenic mouse, JDP2-transgenic (lanes 1) or control wild type mouse (lanes 2) was used. Lanes 3 no DNA was added to the PCR mix. C. Western blot analysis with nuclear extract derived from the indicated tissues of JDP2-transgenic mouse (tg) and liver lysate from wild type mouse (wt). Membranes were probed with anti-JDP2 antibody (top panel) anti-HA antibody (middle panel) and anti-α-tubulin antibody (bottom panel) was used as loading control. The migration of HA-JDP2 transgene and endogenous JDP2 protein is indicated by an arrow at the right side of the top panel. D. β-galactosidase activity with cell lysate derived from the indicated tissues of JDP2-transgenic mouse. The O.D. value at 420 nm is shown. E. Western blot analysis with liver nuclear cell lysate derived from either wild type (wt) or JDP2-transgenic (tg) mice either untreated (-dox) or treated with doxycycline (+dox, 0.2 mg/ml) for 3 days. Membrane was probed sequentially with anti-JDP2 (top panel) followed by anti-α-tubulin (bottom panel) as loading control.
Figure 2
Figure 2
JDP2 expression does not alter liver pathophysiology. A. Immunohistochemistry of liver sections derived from either wild type (wt) or JDP2-transgenic (tg) mice. The expression of HA-JDP2 transgene was analyzed with anti-JDP2 antibody (left panel). The extent of apoptotic and proliferation of hepatocytes was analysed by TUNEL assay (middle panel) and PCNA staining (right panel). Arrows indicate positively stained cells. Liver/body weight ratio (B.) and Serum ALT (C.) was determined from one month old of either wild type control (wt, black bar) or JDP2-transgenic (tg, grey bar) mice. The results represent the average and SEM of the indicated number of animals (n). D. Real time qPCR of the indicated selected genes was performed from cDNA derived from mRNA extracted from liver of wild type and JDP2-transgenic mice. The results represent the calculated expression ratio between JDP-transgenic divided by the expression of the corresponding gene of the wild type mice. The average and SEM of three different experiments performed with pooled mRNA from at least three mice is presented.
Figure 3
Figure 3
Survival curve for the four weeks DEN protocol. A. Schematic diagram is depicted for the four weeks DEN protocol. Mice were injected at four weeks of age with a single DEN injection (100 mg/Kg). At eight weeks of age the tumor promoter, 0.07% phenobarbital was provided in the drinking water in 5% sucrose. B. Mice survival was followed until eleven months of age. The survival of wild type (n = 23, dotted line) versus JDP2-transgenic (n = 24, solid line). Kaplan-Meier analysis performed shows P value < 0.05.
Figure 4
Figure 4
Liver pathology of eleven months old DEN injected mice. Liver/body weight ratio (A.) and Serum ALT (B.) was determined from eleven months old of either wild type control (wt) or JDP2-transgenic (tg) mice. The results represent the average and SEM of the indicated number of animals (n). C. The number of macroscopic tumors (Y axis) and their corresponding size are drawn for each mouse (X axis). The circle size corresponds to the tumor diameter according to the centimeter scale provided at the bottom of the figure. Student's t-test P value < 0.01 D. H&E staining of representative liver sections of DEN injected eleven months old either wild type control (wt) or JDP2-transgenic (tg).
Figure 5
Figure 5
JDP2 role in tumor initiation following DEN injection. Mice were either not treated (0 h) or injected with DEN 100 mg/Kg and sacrificed 24 h and 48 h following injection. Serum ALT (A.) and Liver/body weight ratio (B.) were determined in wild type (wt, black bar) and JDP2-transgenic (tg, grey bar). The results represent the average and SEM of the indicated number of animals (n). C. The expression level of the indicated genes was determined by Real time qPCR to the indicated selected genes from cDNA derived from mRNA prepared from liver tissue of either wild type control (wt) or JDP2-transgenic (tg). The expression level of each gene was normalized by the 18s ribosomal RNA and β2-microglobulin mRNA. The mRNA derived from either non-injected (taken from data set Figure 2D) or mice injected with DEN (100 mg/Kg) sacrificed 24 h thereafter. The results represent the calculated expression ratio between JDP-transgenic divided by the expression level of the corresponding gene in the wild type mice. The average and SEM of three different experiments performed with pooled mRNA from the 0 h-n [tg = 4/wt = 5] and 24 h-n [tg = 3/wt = 2] animals.
Figure 6
Figure 6
Gene expression profile of DEN injected mice at four months of age. Liver/body weight ratio (A.) and serum ALT (B.) were determined in wild type mice (wt, black bar) and JDP2-transgenic mice (tg, grey bar). The results represent the average and SEM of the indicated number of animals (n). C. The expression level of the indicated genes was determined by Real time qPCR to the indicated selected genes from cDNA derived from mRNA prepared from liver tissue of either wild type control (wt) or JDP2-transgenic (tg). The expression level of each gene was normalized by the 18s ribosomal RNA and β2-microglobulin mRNA. The mRNA derived from mice injected with DEN at four weeks of age followed by Phenobarbital treatment from eight weeks of age sacrificed at four months of age. The results represent the calculated expression ratio between JDP2-transgenic (tg) divided by the expression level of the corresponding gene in the wild type mice (wt). The average and SEM of three different experiments performed with pooled mRNA from n [tg = 4/w = 3] animals.
Figure 7
Figure 7
JDP2-tg and liver cancer in 14 days DEN protocol. Mice were injected with DEN 25 mg/Kg at 14 days postnatal and sacrificed at eleven months of age. A. Schematic diagram representing the 14 day DEN protocol and doxycycline treatments used in the indicated experimental groups. Mice were treated with doxycycline 0.2 mg/ml dissolved in 5% sucrose in the drinking water as indicated in the scheme (black line, no JDP2 expression). Grey line represents JDP2 expression. Serum ALT (B.) and Liver/body weight ratio (C.) was determined. The results represent the average and SEM of the indicated number of animals (n). D. The number of macroscopic tumors in liver derived from eleven months old mice injected with DEN and treated as depicted schematically for each experimental group. Wild type (wt, black bar) and JDP2-transgenic (tg). The results represent the average and SEM of the number (n) of animals in each group. Asterisks represent P values < 0.05
Figure 8
Figure 8
Liver tumors analysis for 14 days DEN protocol. A. Representative liver photos derived from either wild type control (wt) and JDP2-transgenic (tg) mice are shown. B. Liver sections stained with H&E of either wild type or JDP2-tg. C. Lung section with metastatic liver tumor derived from JDP2-tg mice is shown. D. Western blot analysis of lysate derived from eleven months old mice of either wild type (wt 1-2, lanes 5-7) or JDP2-transgenic (tg 1-2, lanes 1-4) mice. Lysate was prepared from liver (non Tm, lanes 1-2 and 5-6) and liver tumors (Tm, lanes 3-4 and 7) from the same mouse cohort (indicated by a number) of the doxycycline treated mice as shown in A. Tumors were extracted only from wild type mice #1 representing the different experimental groups. Membranes were probed with anti-JDP2 (top lane in each experimental group) and anti-α-tubulin (bottom lane in each experimental group).

References

    1. Parkin DM, Bray F, Ferlay J, Pisani P. Estimating the world cancer burden: Globocan 2000. Int J Cancer. 2001;94:153–156. doi: 10.1002/ijc.1440. - DOI - PubMed
    1. Block TM, Mehta AS, Fimmel CJ, Jordan R. Molecular viral oncology of hepatocellular carcinoma. Oncogene. 2003;22:5093–5107. doi: 10.1038/sj.onc.1206557. - DOI - PubMed
    1. Nakamoto Y, Kaneko S. Mechanisms of viral hepatitis induced liver injury. Curr Mol Med. 2003;3:537–544. doi: 10.2174/1566524033479591. - DOI - PubMed
    1. Brechot C. Pathogenesis of hepatitis B virus-related hepatocellular carcinoma: old and new paradigms. Gastroenterology. 2004;127:S56–61. doi: 10.1053/j.gastro.2004.09.016. - DOI - PubMed
    1. Wu X, Pandolfi PP. Mouse models for multistep tumorigenesis. Trends Cell Biol. 2001;11:S2–S9. - PubMed

Publication types