

Functional annotation of novel lineage-specific genes using co-expression and promoter analysis
- PMID: 20214810
- PMCID: PMC2848242
- DOI: 10.1186/1471-2164-11-161
Functional annotation of novel lineage-specific genes using co-expression and promoter analysis
Abstract
Background: The diversity of placental architectures within and among mammalian orders is believed to be the result of adaptive evolution. Although, the genetic basis for these differences is unknown, some may arise from rapidly diverging and lineage-specific genes. Previously, we identified 91 novel lineage-specific transcripts (LSTs) from a cow term-placenta cDNA library, which are excellent candidates for adaptive placental functions acquired by the ruminant lineage. The aim of the present study was to infer functions of previously uncharacterized lineage-specific genes (LSGs) using co-expression, promoter, pathway and network analysis.
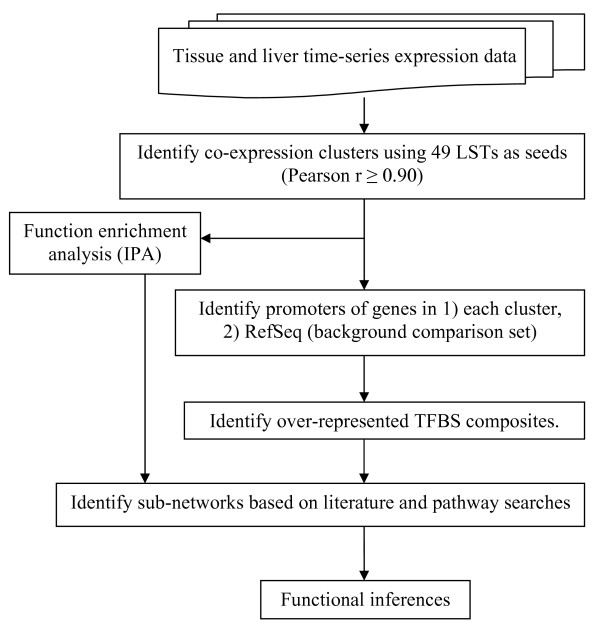
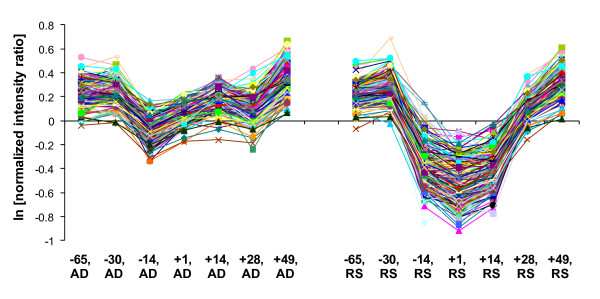
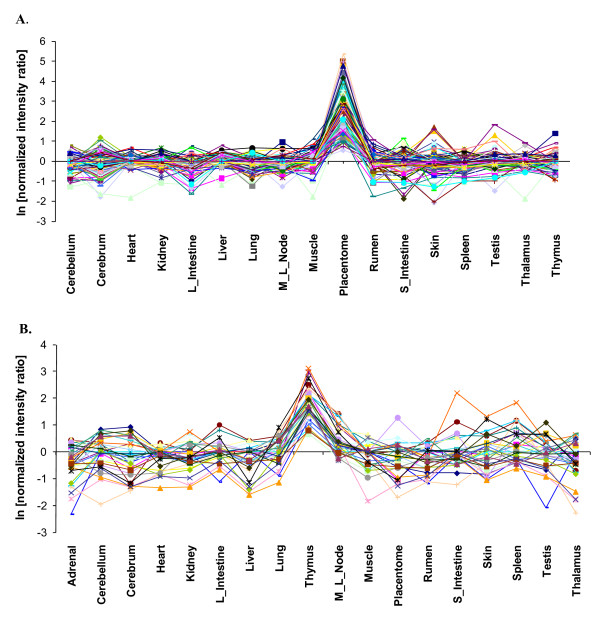
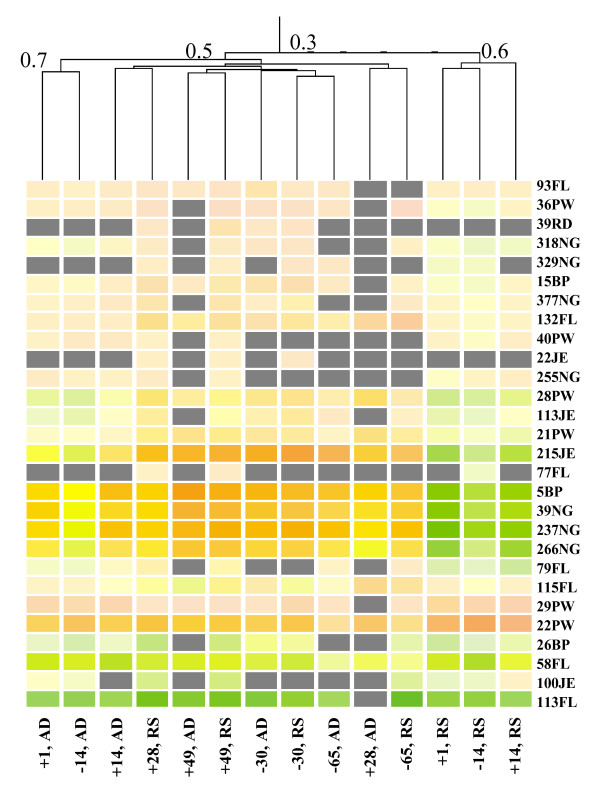
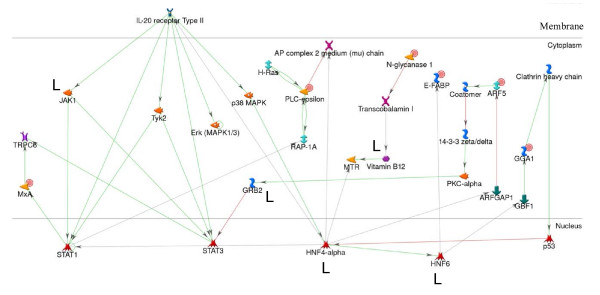
Results: Clusters of co-expressed genes preferentially expressed in liver, placenta and thymus were found using 49 previously uncharacterized LSTs as seeds. Over-represented composite transcription factor binding sites (TFBS) in promoters of clustered LSGs and known genes were then identified computationally. Functions were inferred for nine previously uncharacterized LSGs using co-expression analysis and pathway analysis tools. Our results predict that these LSGs may function in cell signaling, glycerophospholipid/fatty acid metabolism, protein trafficking, regulatory processes in the nucleus, and processes that initiate parturition and immune system development.
Conclusions: The placenta is a rich source of lineage-specific genes that function in the adaptive evolution of placental architecture and functions. We have shown that co-expression, promoter, and gene network analyses are useful methods to infer functions of LSGs with heretofore unknown functions. Our results indicate that many LSGs are involved in cellular recognition and developmental processes. Furthermore, they provide guidance for experimental approaches to validate the functions of LSGs and to study their evolution.
Figures
Similar articles
-
Discovery and characterization of 91 novel transcripts expressed in cattle placenta.BMC Genomics. 2007 May 9;8:113. doi: 10.1186/1471-2164-8-113. BMC Genomics. 2007. PMID: 17488528 Free PMC article.
-
Global gene expression analysis and regulation of the principal genes expressed in bovine placenta in relation to the transcription factor AP-2 family.Reprod Biol Endocrinol. 2007 Apr 27;5:17. doi: 10.1186/1477-7827-5-17. Reprod Biol Endocrinol. 2007. PMID: 17462098 Free PMC article.
-
Placental transcriptome co-expression analysis reveals conserved regulatory programs across gestation.BMC Genomics. 2017 Jan 3;18(1):10. doi: 10.1186/s12864-016-3384-9. BMC Genomics. 2017. PMID: 28049421 Free PMC article.
-
Evolution of promoter affinity for transcription factors in the human lineage.Mol Biol Evol. 2011 Aug;28(8):2173-83. doi: 10.1093/molbev/msr027. Epub 2011 Feb 18. Mol Biol Evol. 2011. PMID: 21335606
-
[Advances in lineage-specific genes].Yi Chuan. 2015 Jun;37(6):544-53. doi: 10.16288/j.yczz.14-392. Yi Chuan. 2015. PMID: 26351050 Review. Chinese.
Cited by
-
Characterization of barley Prp1 gene and its expression during seed development and under abiotic stress.Genetica. 2011 Oct;139(10):1283-92. doi: 10.1007/s10709-012-9630-4. Genetica. 2011. PMID: 22290495
-
Genomic analysis of the hydrocarbon-producing, cellulolytic, endophytic fungus Ascocoryne sarcoides.PLoS Genet. 2012;8(3):e1002558. doi: 10.1371/journal.pgen.1002558. Epub 2012 Mar 1. PLoS Genet. 2012. PMID: 22396667 Free PMC article.
-
Novel SNPs and InDels discovered in two promoter regions of porcine pregnancy-associated glycoprotein 2-like subfamily (pPAG2-Ls) in crossbreed pigs.Funct Integr Genomics. 2016 Nov;16(6):705-715. doi: 10.1007/s10142-016-0522-z. Epub 2016 Oct 5. Funct Integr Genomics. 2016. PMID: 27709373 Free PMC article.
-
Genome-wide patterns of promoter sharing and co-expression in bovine skeletal muscle.BMC Genomics. 2011 Jan 12;12:23. doi: 10.1186/1471-2164-12-23. BMC Genomics. 2011. PMID: 21226902 Free PMC article.
References
-
- Mossman HW. Vertebrate Fetal Membranes. Houndmills: MacMillan; 1987. pp. 288–290.
-
- Yoon H, He H, Nagy R, Davuluri R, Suster S, Schoenberg D, Pellegata N, Chapelle Ade L. Identification of a novel noncoding RNA gene, NAMA, that is downregulated in papillary thyroid carcinoma with BRAF mutation and associated with growth arrest. Int J Cancer. 2007;121:767–75. doi: 10.1002/ijc.22701. - DOI - PubMed
MeSH terms
Substances
LinkOut - more resources
Full Text Sources
