

Pancreatic adenocarcinoma exerts systemic effects on the peripheral blood myeloid and plasmacytoid dendritic cells: an indicator of disease severity?
- PMID: 20214814
- PMCID: PMC2847547
- DOI: 10.1186/1471-2407-10-87
Pancreatic adenocarcinoma exerts systemic effects on the peripheral blood myeloid and plasmacytoid dendritic cells: an indicator of disease severity?
Abstract
Background: Dendritic cells (DCs) isolated from tumor bearing animals or from individuals with solid tumors display functional abnormalities and the DC impairment has emerged as one mechanism for tumor evasion from the control of the immune system. Ductal pancreatic adenocarcinoma (PDAC), the most common pancreatic cancer, is recognized as a very aggressive cancer type with a mortality that almost matches the rate of incidence.
Methods: We examined the systemic influence ductal pancreatic adenocarcinoma (PDAC) exerted on levels of peripheral blood DCs and inflammatory mediators in comparison to the effects exerted by other pancreatic tumors, chronic pancreatitis, and age-matched controls.
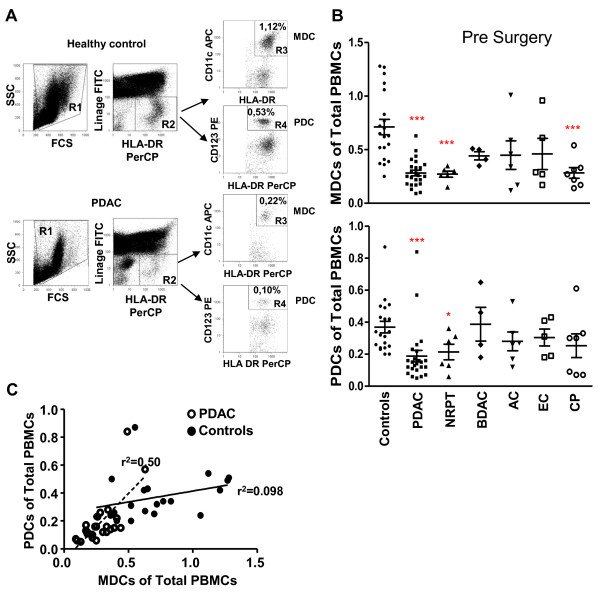
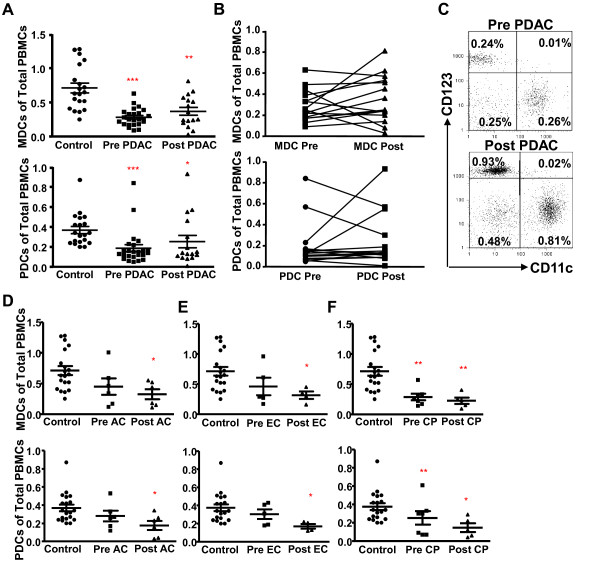
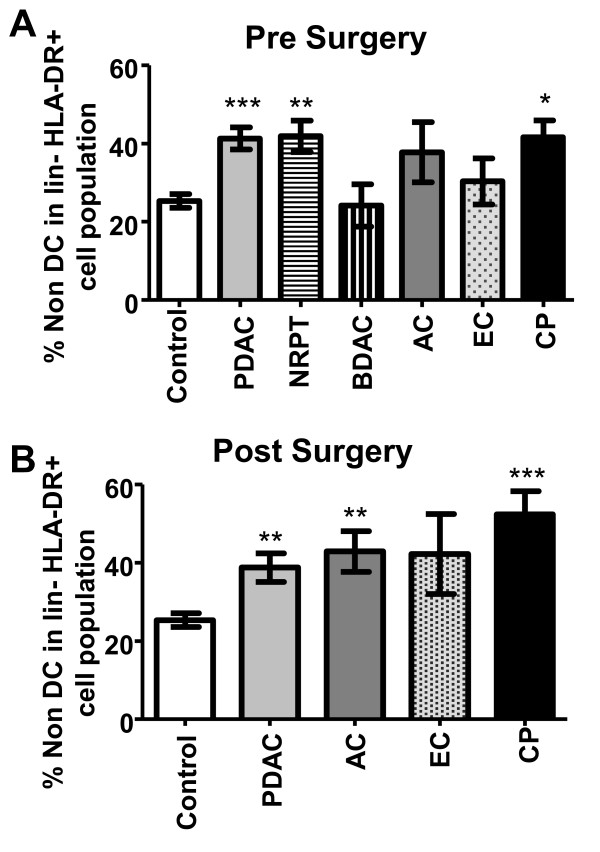
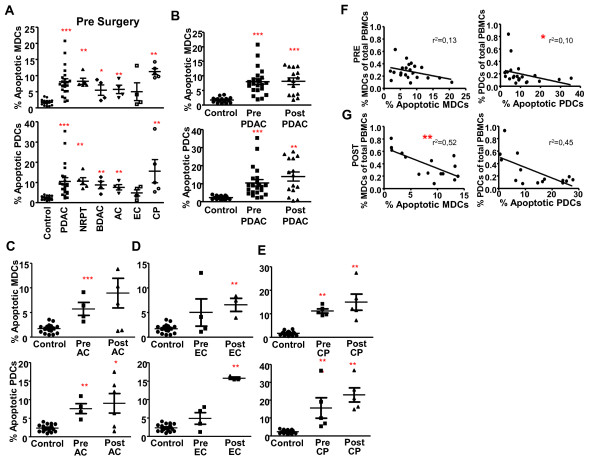
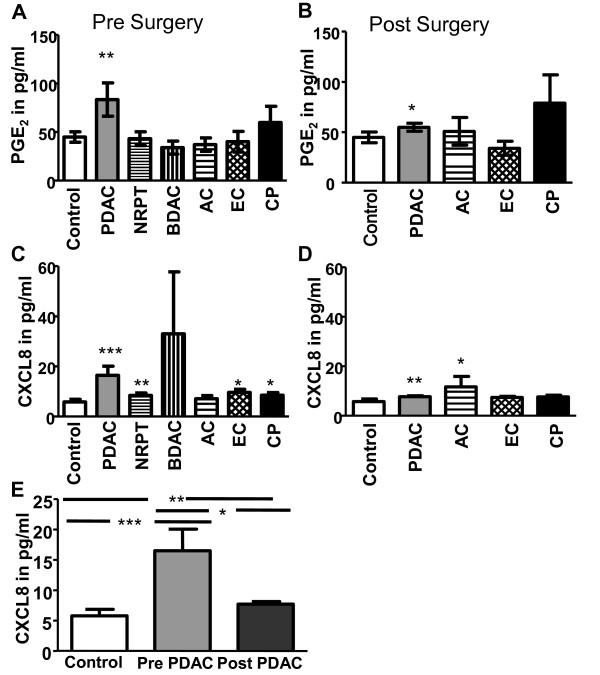
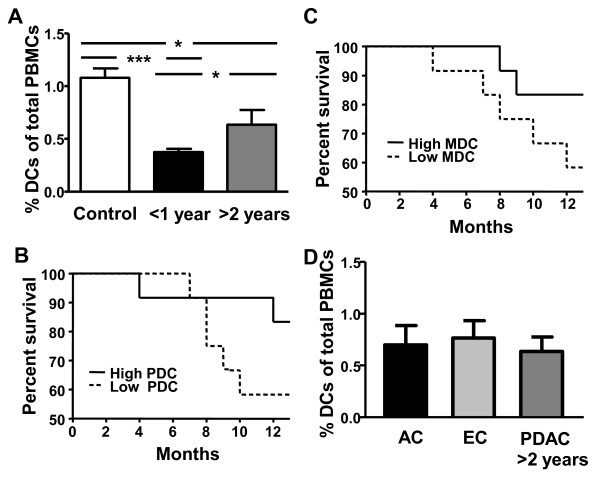
Results: All groups examined, including PDAC, had decreased levels of myeloid DCs (MDC) and plasmacytoid DCs (PDC) and enhanced apoptosis in these cells as compared to controls. We found elevated levels of PGE2 and CXCL8 in subjects with PDAC, and chronic pancreatitis. Levels of these inflammatory factors were in part restored in PDAC after tumor resection, whereas the levels of DCs were impaired in the majority of these patients approximately 12 weeks after tumor removal. Our results prove that solid pancreatic tumors, including PDAC, systemically affect blood DCs. The impairments do not seem to be tumor-specific, since similar results were obtained in subjects with chronic pancreatitis. Furthermore, we found that PDAC patients with a survival over 2 years had significant higher levels of blood DCs compared to patients with less than one year survival.
Conclusions: Our findings points to the involvement of inflammation in the destruction of the blood MDCs and PDCs. Furthermore, the preservation of the blood DCs compartment in PDAC patients seems to benefit their ability to control the disease and survival.
Figures
Similar articles
-
Semi mature blood dendritic cells exist in patients with ductal pancreatic adenocarcinoma owing to inflammatory factors released from the tumor.PLoS One. 2010 Oct 15;5(10):e13441. doi: 10.1371/journal.pone.0013441. PLoS One. 2010. PMID: 20976171 Free PMC article.
-
Peripheral blood dendritic cells in human end-stage heart failure and the early post-transplant period: evidence for systemic Th1 immune responses.Eur J Cardiothorac Surg. 2004 Apr;25(4):619-26. doi: 10.1016/j.ejcts.2004.01.032. Eur J Cardiothorac Surg. 2004. PMID: 15037281
-
Circulating myeloid dendritic cells as prognostic factors in patients with pancreatic cancer who have undergone surgical resection.J Surg Res. 2012 Apr;173(2):299-308. doi: 10.1016/j.jss.2010.09.027. Epub 2010 Oct 16. J Surg Res. 2012. PMID: 21195425
-
Toward a better understanding of pancreatic ductal adenocarcinoma: glimmers of hope?Pancreas. 2013 Jul;42(5):729-39. doi: 10.1097/MPA.0b013e318288107a. Pancreas. 2013. PMID: 23648843 Review.
-
Metabolic tumor burden: a new promising way to reach precise personalized therapy in PDAC.Cancer Lett. 2015 Apr 10;359(2):165-8. doi: 10.1016/j.canlet.2015.01.023. Epub 2015 Jan 21. Cancer Lett. 2015. PMID: 25617800 Review.
Cited by
-
Human mesothelioma induces defects in dendritic cell numbers and antigen-processing function which predict survival outcomes.Oncoimmunology. 2015 Aug 31;5(2):e1082028. doi: 10.1080/2162402X.2015.1082028. eCollection 2016 Feb. Oncoimmunology. 2015. PMID: 27057464 Free PMC article.
-
Human Plasmacytoid Dendritic Cells and Cutaneous Melanoma.Cells. 2020 Feb 11;9(2):417. doi: 10.3390/cells9020417. Cells. 2020. PMID: 32054102 Free PMC article. Review.
-
Regulatory dendritic cells: there is more than just immune activation.Front Immunol. 2012 Sep 4;3:274. doi: 10.3389/fimmu.2012.00274. eCollection 2012. Front Immunol. 2012. PMID: 22969767 Free PMC article.
-
Interleukin 1α sustains the expression of inflammatory factors in human pancreatic cancer microenvironment by targeting cancer-associated fibroblasts.Neoplasia. 2011 Aug;13(8):664-75. doi: 10.1593/neo.11332. Neoplasia. 2011. PMID: 21847358 Free PMC article.
-
Complex role for the immune system in initiation and progression of pancreatic cancer.World J Gastroenterol. 2014 Aug 28;20(32):11160-81. doi: 10.3748/wjg.v20.i32.11160. World J Gastroenterol. 2014. PMID: 25170202 Free PMC article. Review.
References
-
- Verslype C, Van Cutsem E, Dicato M, Cascinu S, Cunningham D, Diaz-Rubio E, Glimelius B, Haller D, Haustermans K, Heinemann V. The management of pancreatic cancer. Current expert opinion and recommendations derived from the 8th World Congress on Gastrointestinal Cancer, Barcelona, 2006. Ann Oncol. 2007;18(Suppl 7):vii1–vii10. doi: 10.1093/annonc/mdm210. - DOI - PubMed
Publication types
MeSH terms
Substances
LinkOut - more resources
Full Text Sources
Medical
