

Transcriptional and pathway analysis in the hypothalamus of newly hatched chicks during fasting and delayed feeding
- PMID: 20214824
- PMCID: PMC2848243
- DOI: 10.1186/1471-2164-11-162
Transcriptional and pathway analysis in the hypothalamus of newly hatched chicks during fasting and delayed feeding
Abstract
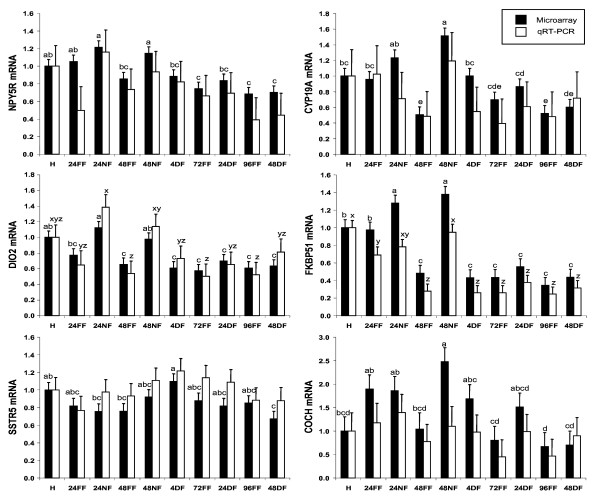
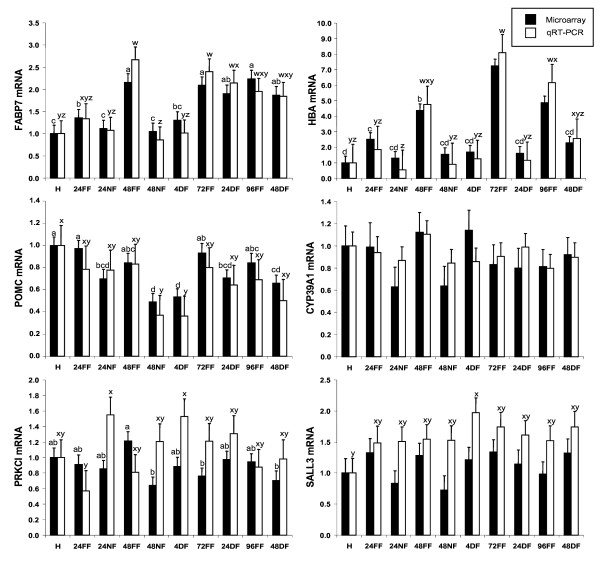
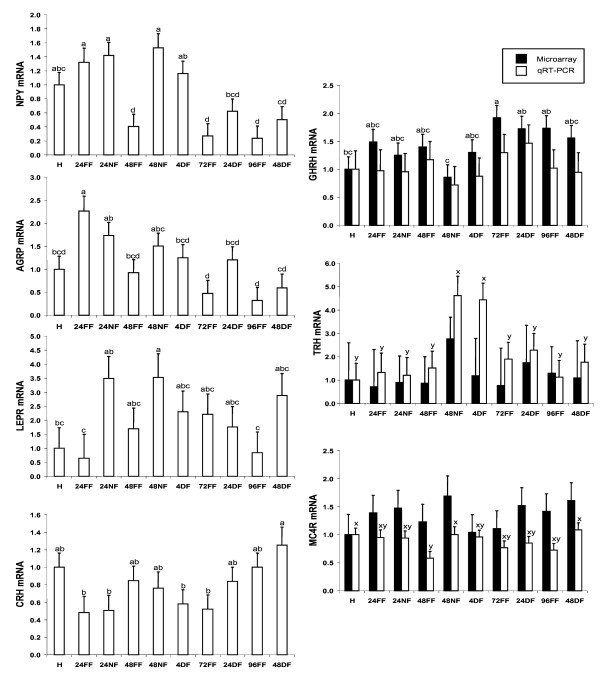
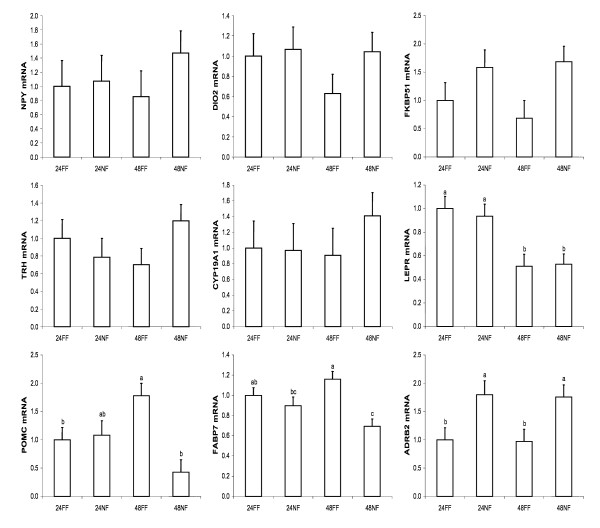
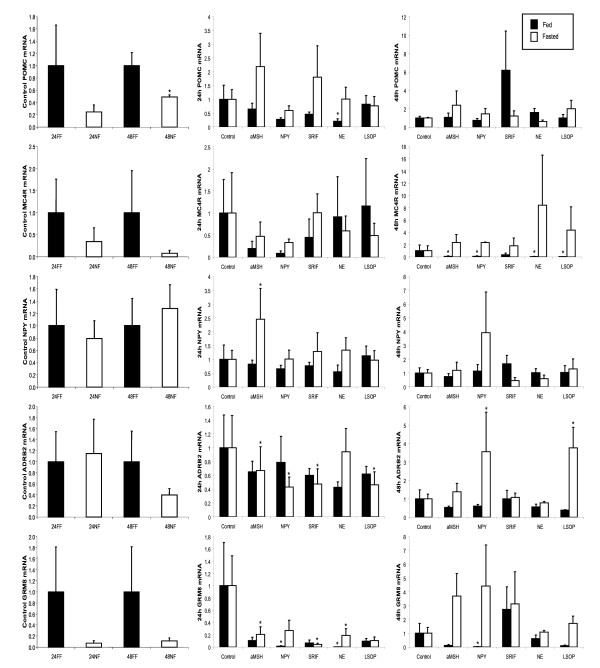
Background: The hypothalamus plays a central role in regulating appetite and metabolism. However, the gene networks within the hypothalamus that regulate feed intake and metabolism, and the effects of fasting on those pathways are not completely understood in any species. The present experiment evaluated global hypothalamic gene expression in newly hatched chicks using microarray analysis to elucidate genes and pathways regulated by feeding, fasting, and delayed feeding. Ten groups of chicks were sampled over four days post-hatch, including fed, fasted, and 48 h fasted followed by access to feed for 4 h, 24 h, and 48 h. Hypothalamic samples were collected for microarray analysis (n = 4). Expression patterns of selected genes were confirmed by quantitative real-time PCR. Pathway analysis of the microarray results predicted a network of genes involved in neuropeptide or neurotransmitter signaling. To confirm the functionality of this predicted gene network, hypothalamic neurons from fed and fasted chicks were isolated and cultured in the presence of neuropeptide Y, somatostatin, alpha-melanocyte stimulating hormone, norepinephrine, and L-phospho-serine. Results confirmed functional relationships among members of the predicted gene network. Moreover, the effects observed were dependent upon the nutritional state of the animals (fed vs. fasted).
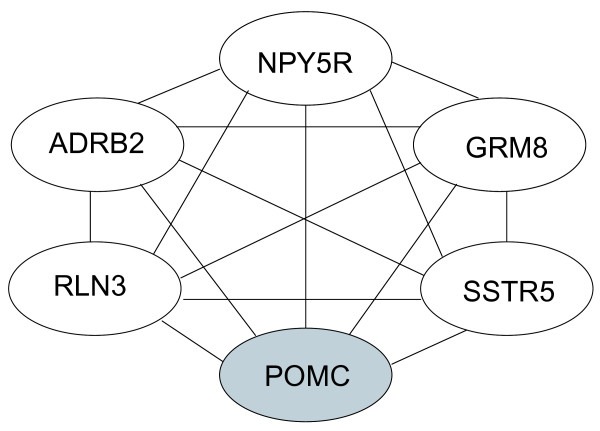
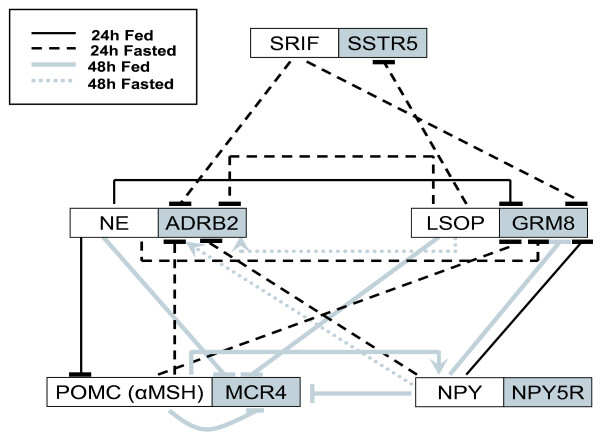
Results: Differences in gene expression (> or = 1.6 fold) were detected in 1,272 genes between treatments, and of those, 119 genes were significantly (P < 0.05) different. Pathway Miner analysis revealed that six genes (SSTR5, NPY5R, POMC, ADRB2, GRM8, and RLN3) were associated within a gene network. In vitro experiments with primary hypothalamic neurons confirmed that receptor agonists involved in this network regulated expression of other genes in the predicted network, and this regulation within the network was influenced by the nutritional status and age of the chick.
Conclusions: Microarray analysis of the hypothalamus during different nutritional states revealed that many genes are differentially regulated. We found that functional interactions exist among six differentially regulated genes associated within a putative gene network from this experiment. Considering that POMC, an important gene in controlling metabolism, was central to this network, this gene network may play an important role in regulation of feeding and metabolism in birds.
Figures
Similar articles
-
Fasting alters protein expression of AMP-activated protein kinase in the hypothalamus of broiler chicks (Gallus gallus domesticus).Gen Comp Endocrinol. 2012 Sep 15;178(3):546-55. doi: 10.1016/j.ygcen.2012.06.026. Epub 2012 Jul 5. Gen Comp Endocrinol. 2012. PMID: 22771832
-
Transcriptome analyses of liver in newly-hatched chicks during the metabolic perturbation of fasting and re-feeding reveals THRSPA as the key lipogenic transcription factor.BMC Genomics. 2020 Jan 31;21(1):109. doi: 10.1186/s12864-020-6525-0. BMC Genomics. 2020. PMID: 32005146 Free PMC article.
-
Differential gene expression pattern in hypothalamus of chickens during fasting-induced metabolic reprogramming: functions of glucose and lipid metabolism in the feed intake of chickens.Poult Sci. 2014 Nov;93(11):2841-54. doi: 10.3382/ps.2014-04047. Epub 2014 Sep 19. Poult Sci. 2014. PMID: 25239532
-
Hypothalamic neuronal networks and feeding-related peptides involved in the regulation of feeding.Anat Sci Int. 2003 Sep;78(3):123-38. doi: 10.1046/j.0022-7722.2003.00055.x. Anat Sci Int. 2003. PMID: 14527127 Review.
-
Genetic control of food intake in chickens.J Nutr. 1994 Aug;124(8 Suppl):1341S-1348S. doi: 10.1093/jn/124.suppl_8.1341S. J Nutr. 1994. PMID: 8064382 Review.
Cited by
-
Investigating the Impact of Fasting and Refeeding on Blood Biochemical Indicators and Transcriptional Profiles in the Hypothalamus and Subcutaneous Adipose Tissue in Geese.Animals (Basel). 2024 Sep 23;14(18):2746. doi: 10.3390/ani14182746. Animals (Basel). 2024. PMID: 39335335 Free PMC article.
-
Avian genomics lends insights into endocrine function in birds.Gen Comp Endocrinol. 2018 Jan 15;256:123-129. doi: 10.1016/j.ygcen.2017.05.023. Epub 2017 Jun 17. Gen Comp Endocrinol. 2018. PMID: 28596079 Free PMC article. Review.
-
Regulation of Agouti-Related Protein and Pro-Opiomelanocortin Gene Expression in the Avian Arcuate Nucleus.Front Endocrinol (Lausanne). 2017 Apr 13;8:75. doi: 10.3389/fendo.2017.00075. eCollection 2017. Front Endocrinol (Lausanne). 2017. PMID: 28450851 Free PMC article. Review.
-
Should I Lay or Should I Grow: Photoperiodic Versus Metabolic Cues in Chickens.Front Physiol. 2020 Jun 26;11:707. doi: 10.3389/fphys.2020.00707. eCollection 2020. Front Physiol. 2020. PMID: 32670092 Free PMC article. Review.
-
Mapping Molecular Datasets Back to the Brain Regions They are Extracted from: Remembering the Native Countries of Hypothalamic Expatriates and Refugees.Adv Neurobiol. 2018;21:101-193. doi: 10.1007/978-3-319-94593-4_6. Adv Neurobiol. 2018. PMID: 30334222 Free PMC article.
References
-
- Kuenzel WJ. Central neuroanatomical systems involved in the regulation of food intake in birds and mammals. J Nutr. 1994;124:1355S–1370S. - PubMed
-
- Richards MP, Proszkowiec-Weglarz M. Mechanisms regulating food intake, energy expenditure, and body weight in poultry. Poultry Science. 2007;86:1478–1490. - PubMed
-
- Furuse M. Central regulation of food intake in the neonatal chick. Animal Science Journal. 2002;73:83–94. doi: 10.1046/j.1344-3941.2002.00014.x. - DOI
-
- Boswell T. Regulation of energy balance in birds by the neuroendocrine hypothalamus. The Journal of Poultry Science. 2005;42:161–181. doi: 10.2141/jpsa.42.161. - DOI
Publication types
MeSH terms
LinkOut - more resources
Full Text Sources
Molecular Biology Databases
Miscellaneous
