

HGF-induced invasion by prostate tumor cells requires anterograde lysosome trafficking and activity of Na+-H+ exchangers
- PMID: 20215403
- PMCID: PMC2844323
- DOI: 10.1242/jcs.063644
HGF-induced invasion by prostate tumor cells requires anterograde lysosome trafficking and activity of Na+-H+ exchangers
Abstract
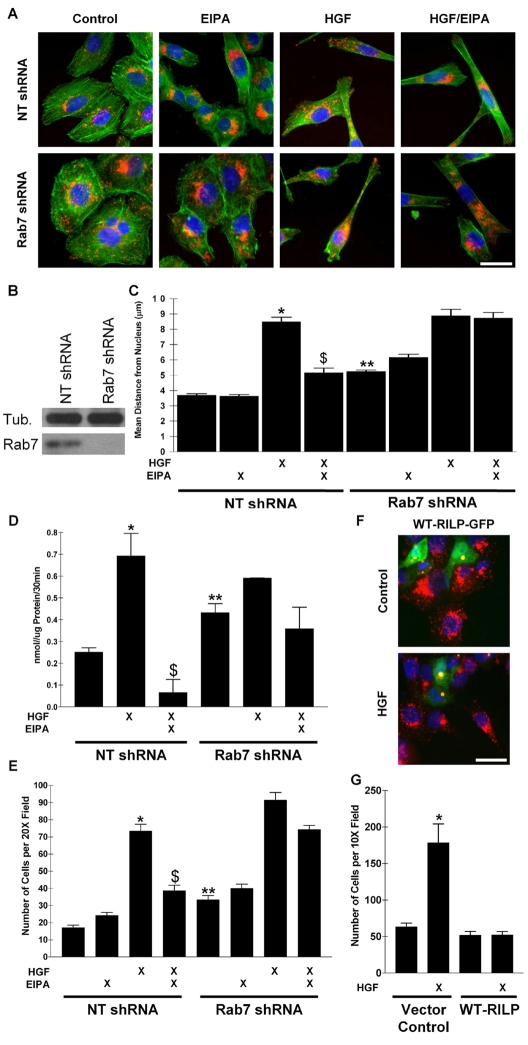
Hepatocyte growth factor (HGF) is found in tumor microenvironments, and interaction with its tyrosine kinase receptor Met triggers cell invasion and metastasis. It was previously shown that acidic extracellular pH stimulated peripheral lysosome trafficking, resulting in increased cathepsin B secretion and tumor cell invasion, which was dependent upon sodium-proton exchanger (NHE) activity. We now demonstrate that HGF induced the trafficking of lysosomes to the cell periphery, independent of HGF-induced epithelial-mesenchymal transition. HGF-induced anterograde lysosome trafficking depended upon the PI3K pathway, microtubules and RhoA, resulting in increased cathepsin B secretion and invasion by the cells. HGF-induced NHE activity via increased net acid production, and inhibition of NHE activity with 5-(N-ethyl-N-isopropyl)-amiloride (EIPA), or a combination of the NHE1-specific drug cariporide and the NHE3-specific drug s3226 prevented HGF-induced anterograde trafficking and induced retrograde trafficking in HGF-overexpressing cells. EIPA treatment reduced cathepsin B secretion and HGF-induced invasion by the tumor cells. Lysosomes were located more peripherally in Rab7-shRNA-expressing cells and these cells were more invasive than control cells. Overexpression of the Rab7 effector protein, RILP, resulted in a juxtanuclear location of lysosomes and reduced HGF-induced invasion. Together, these results suggest that the location of lysosomes is an inherently important aspect of invasion by tumor cells.
Figures


Similar articles
-
Na+/H+ exchangers and RhoA regulate acidic extracellular pH-induced lysosome trafficking in prostate cancer cells.Traffic. 2009 Jun;10(6):737-53. doi: 10.1111/j.1600-0854.2009.00904.x. Traffic. 2009. PMID: 19302267
-
Thiazolidinediones induce Rab7-RILP-MAPK-dependent juxtanuclear lysosome aggregation and reduce tumor cell invasion.Traffic. 2010 Feb;11(2):274-86. doi: 10.1111/j.1600-0854.2009.01012.x. Epub 2009 Dec 5. Traffic. 2010. PMID: 20015112
-
A Novel High Content Imaging-Based Screen Identifies the Anti-Helminthic Niclosamide as an Inhibitor of Lysosome Anterograde Trafficking and Prostate Cancer Cell Invasion.PLoS One. 2016 Jan 19;11(1):e0146931. doi: 10.1371/journal.pone.0146931. eCollection 2016. PLoS One. 2016. PMID: 26784896 Free PMC article.
-
Molecular characteristics of HGF-SF and its role in cell motility and invasion.EXS. 1993;65:311-28. EXS. 1993. PMID: 8380739 Review.
-
Structure, biosynthesis and biochemical properties of the HGF receptor in normal and malignant cells.EXS. 1993;65:131-65. EXS. 1993. PMID: 8380735 Review.
Cited by
-
BORC Functions Upstream of Kinesins 1 and 3 to Coordinate Regional Movement of Lysosomes along Different Microtubule Tracks.Cell Rep. 2016 Nov 15;17(8):1950-1961. doi: 10.1016/j.celrep.2016.10.062. Cell Rep. 2016. PMID: 27851960 Free PMC article.
-
PAK inhibitor FRAX486 decreases the metastatic potential of triple-negative breast cancer cells by blocking autophagy.Br J Cancer. 2024 Feb;130(3):394-405. doi: 10.1038/s41416-023-02523-4. Epub 2023 Dec 18. Br J Cancer. 2024. PMID: 38110664 Free PMC article.
-
Lipogenesis mediated by OGR1 regulates metabolic adaptation to acid stress in cancer cells via autophagy.Cell Rep. 2022 May 10;39(6):110796. doi: 10.1016/j.celrep.2022.110796. Cell Rep. 2022. PMID: 35545051 Free PMC article.
-
Artesunate activates mitochondrial apoptosis in breast cancer cells via iron-catalyzed lysosomal reactive oxygen species production.J Biol Chem. 2011 Feb 25;286(8):6587-601. doi: 10.1074/jbc.M110.210047. Epub 2010 Dec 13. J Biol Chem. 2011. PMID: 21149439 Free PMC article.
-
Identification of candidate genes associated with bipolar disorder by whole-exome sequencing of a Chinese multi-affected pedigree.BMC Psychiatry. 2025 Jul 1;25(1):612. doi: 10.1186/s12888-025-07002-z. BMC Psychiatry. 2025. PMID: 40597885 Free PMC article.
References
-
- Agarwal S., Zerillo C., Kolmakova J., Christensen J. G., Harris L. N., Rimm D. L., DiGiovanna M. P., Stern D. F. (2009). Association of constitutively activated hepatocyte growth factor receptor (Met) with resistance to a dual EGFR//Her2 inhibitor in non-small-cell lung cancer cells. Br. J. Cancer 100, 941-949 - PMC - PubMed
-
- Benvenuti S., Comoglio P. M. (2007). The MET receptor tyrosine kinase in invasion and metastasis. J. Cell. Physiol. 213, 316-325 - PubMed
-
- Bertola A., Bonnafous S., Cormont M., Anty R., Tanti J.-F., Tran A., Le Marchand-Brustel Y., Gual P. (2007). Hepatocyte growth factor induces glucose uptake in 3T3-L1 adipocytes through a Gab1/phosphatidylinositol 3-kinase/Glut4 pathway. J. Biol. Chem. 282, 10325-10332 - PubMed
-
- Birchmeier C., Birchmeier W., Gherardi E., Vande Woude G. F. (2003). Met, metastasis, motility and more. Nat. Rev. Mol. Cell Biol. 4, 915-925 - PubMed
Publication types
MeSH terms
Substances
Grants and funding
LinkOut - more resources
Full Text Sources
Other Literature Sources
Medical
Miscellaneous
