

Expression profiling after activation of amino acid deprivation response in HepG2 human hepatoma cells
- PMID: 20215415
- PMCID: PMC2869104
- DOI: 10.1152/physiolgenomics.00217.2009
Expression profiling after activation of amino acid deprivation response in HepG2 human hepatoma cells
Abstract
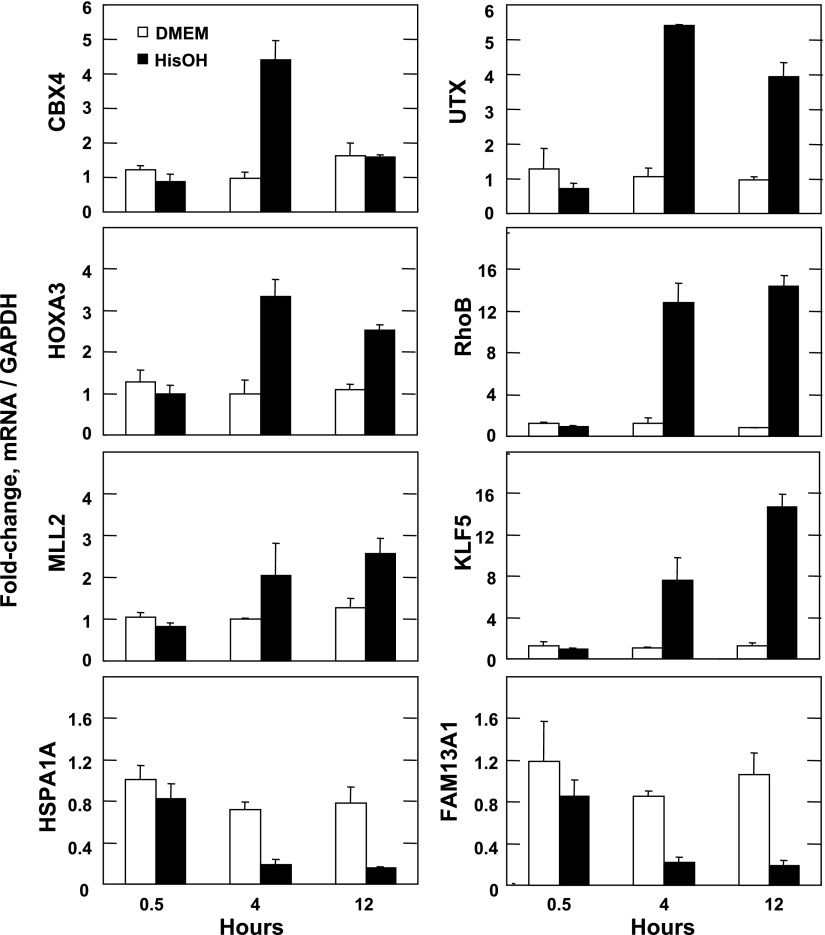
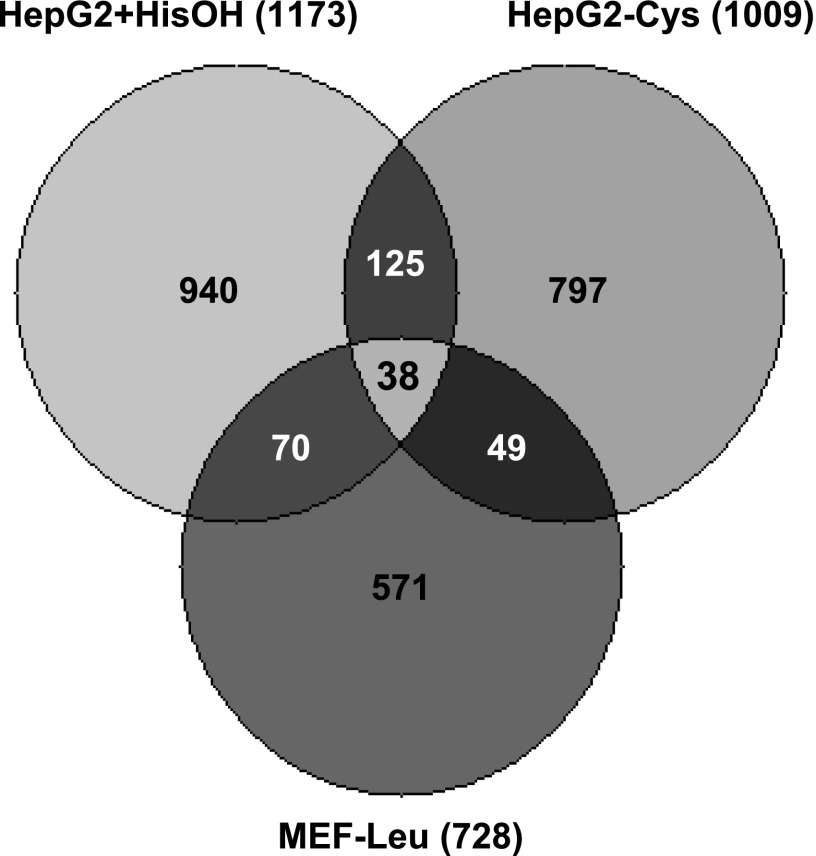
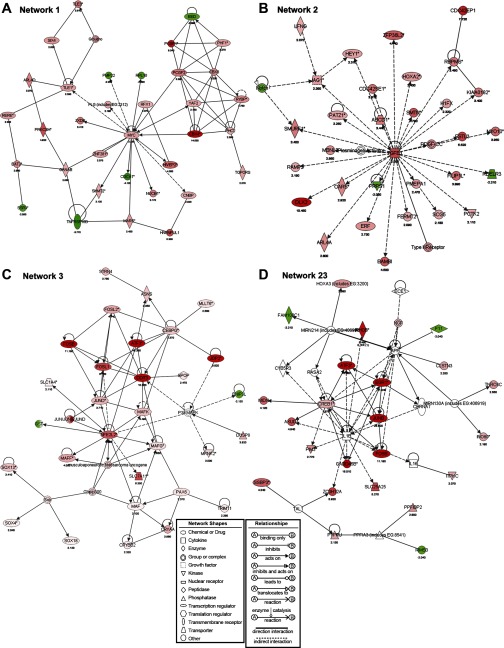
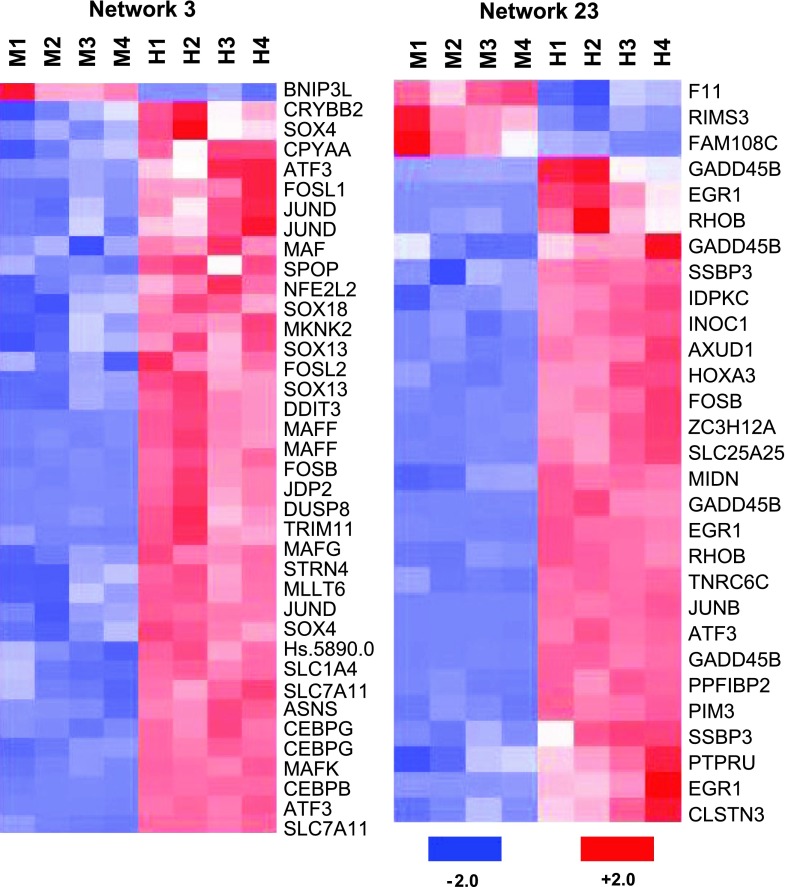
Dietary protein malnutrition is manifested as amino acid deprivation of individual cells, which activates an amino acid response (AAR) that alters cellular functions, in part, by regulating transcriptional and posttranscriptional mechanisms. The AAR was activated in HepG2 human hepatoma cells, and the changes in mRNA content were analyzed by microarray expression profiling. The results documented that 1,507 genes were differentially regulated by P < 0.001 and by more than twofold in response to the AAR, 250 downregulated and 1,257 upregulated. The spectrum of altered genes reveals that amino acid deprivation has far-reaching implications for gene expression and cellular function. Among those cellular functions with the largest numbers of altered genes were cell growth and proliferation, cell cycle, gene expression, cell death, and development. Potential biological relationships between the differentially expressed genes were analyzed by computer software that generates gene networks. Proteins that were central to the most significant of these networks included c-myc, polycomb group proteins, transforming growth factor β1, nuclear factor (erythroid-derived 2)-like 2-related factor 2, FOS/JUN family members, and many members of the basic leucine zipper superfamily of transcription factors. Although most of these networks contained some genes that were known to be amino acid responsive, many new relationships were identified that underscored the broad impact that amino acid stress has on cellular function.
Keywords: liver gene expression; microarray; nutrient sensing; starvation.
Figures
Similar articles
-
MAPK signaling triggers transcriptional induction of cFOS during amino acid limitation of HepG2 cells.Biochim Biophys Acta. 2015 Mar;1853(3):539-48. doi: 10.1016/j.bbamcr.2014.12.013. Epub 2014 Dec 16. Biochim Biophys Acta. 2015. PMID: 25523140 Free PMC article.
-
Auto-activation of c-JUN gene by amino acid deprivation of hepatocellular carcinoma cells reveals a novel c-JUN-mediated signaling pathway.J Biol Chem. 2011 Oct 21;286(42):36724-38. doi: 10.1074/jbc.M111.277673. Epub 2011 Aug 23. J Biol Chem. 2011. PMID: 21862593 Free PMC article.
-
The RNA expression signature of the HepG2 cell line as determined by the integrated analysis of miRNA and mRNA expression profiles.Gene. 2014 Sep 10;548(1):91-100. doi: 10.1016/j.gene.2014.07.016. Epub 2014 Jul 9. Gene. 2014. PMID: 25014136
-
The transcription factor network associated with the amino acid response in mammalian cells.Adv Nutr. 2012 May 1;3(3):295-306. doi: 10.3945/an.112.001891. Adv Nutr. 2012. PMID: 22585903 Free PMC article. Review.
-
Complex analysis of genes involved in the inflammatory response: interleukin-1-induced differential transcriptome of cultured human hepatoma HepG2 cells.Acta Biochim Pol. 2003;50(3):573-82. Acta Biochim Pol. 2003. PMID: 14515140 Review.
Cited by
-
L-threonine regulates G1/S phase transition of mouse embryonic stem cells via PI3K/Akt, MAPKs, and mTORC pathways.J Biol Chem. 2011 Jul 8;286(27):23667-78. doi: 10.1074/jbc.M110.216283. Epub 2011 May 6. J Biol Chem. 2011. PMID: 21550972 Free PMC article.
-
Influence of Amino Acid Metabolism on Embryonic Stem Cell Function and Differentiation.Adv Nutr. 2016 Jul 15;7(4):780S-9S. doi: 10.3945/an.115.011031. Print 2016 Jul. Adv Nutr. 2016. PMID: 27422515 Free PMC article. Review.
-
Pathogenic autoantibody internalization in myositis.medRxiv [Preprint]. 2024 Jan 17:2024.01.15.24301339. doi: 10.1101/2024.01.15.24301339. medRxiv. 2024. Update in: Ann Rheum Dis. 2024 Oct 21;83(11):1549-1560. doi: 10.1136/ard-2024-225773. PMID: 38313303 Free PMC article. Updated. Preprint.
-
A novel autoregulatory loop between the Gcn2-Atf4 pathway and (L)-Proline [corrected] metabolism controls stem cell identity.Cell Death Differ. 2015 Jul;22(7):1094-105. doi: 10.1038/cdd.2015.24. Epub 2015 Apr 10. Cell Death Differ. 2015. PMID: 25857264 Free PMC article.
-
Dynamic changes in genomic histone association and modification during activation of the ASNS and ATF3 genes by amino acid limitation.Biochem J. 2013 Jan 1;449(1):219-29. doi: 10.1042/BJ20120958. Biochem J. 2013. PMID: 22978410 Free PMC article.
References
-
- Abcouwer SF, Marjon PL, Loper RK, Vander Jagt DL. Response of VEGF expression to amino acid deprivation and inducers of endoplasmic reticulum stress. Invest Ophthalmol Vis Sci 43: 2791–2798, 2002. - PubMed
-
- Ansari KI, Mishra BP, Mandal SS. MLL histone methylases in gene expression, hormone signaling and cell cycle. Front Biosci 14: 3483–3495, 2009. - PubMed
-
- Bruhat A, Cherasse Y, Chaveroux C, Maurin AC, Jousse C, Fafournoux P. Amino acids as regulators of gene expression in mammals: molecular mechanisms. Biofactors 35: 249–257, 2009. - PubMed
-
- Bruhat A, Jousse C, Wang XZ, Ron D, Ferrara M, Fafournoux P. Amino acid limitation induces expression of CHOP, a CCAAT/enhancer binding protein-related gene, at both transcriptional and post-transcriptional levels. J Biol Chem 272: 17588–17593, 1997. - PubMed
Publication types
MeSH terms
Substances
Grants and funding
LinkOut - more resources
Full Text Sources
Other Literature Sources
Medical
Molecular Biology Databases
Miscellaneous