. 2010 Jul;38(12):4027-39.
doi: 10.1093/nar/gkq127. Epub 2010 Mar 9.

Trinucleotide repeats in human genome and exome

Affiliations

Trinucleotide repeats in human genome and exome

Piotr Kozlowski et al. Nucleic Acids Res. 2010 Jul.

Abstract

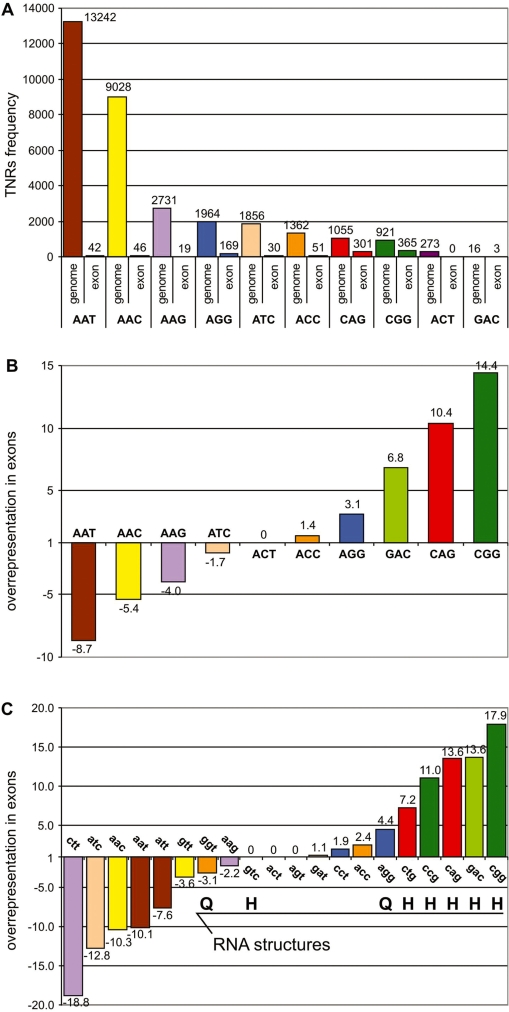
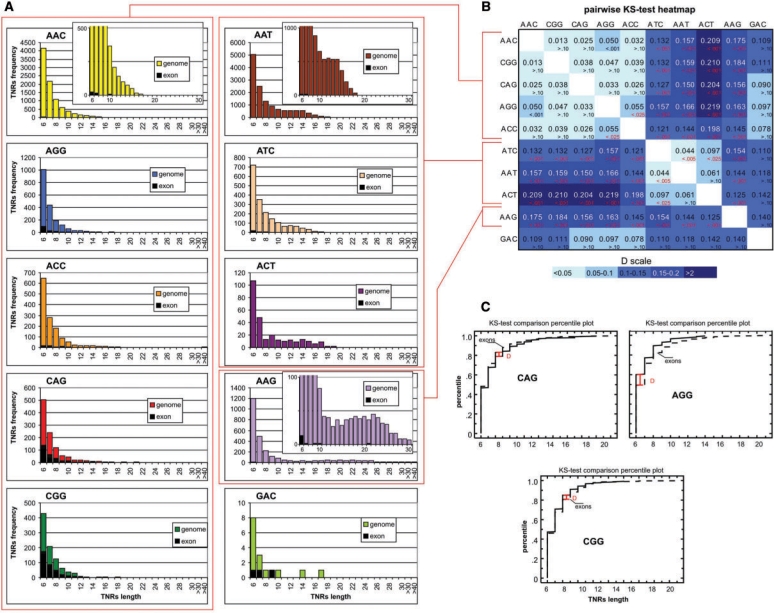
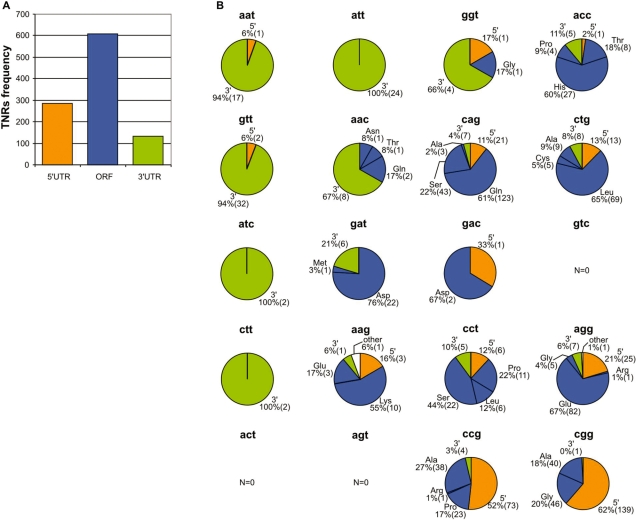
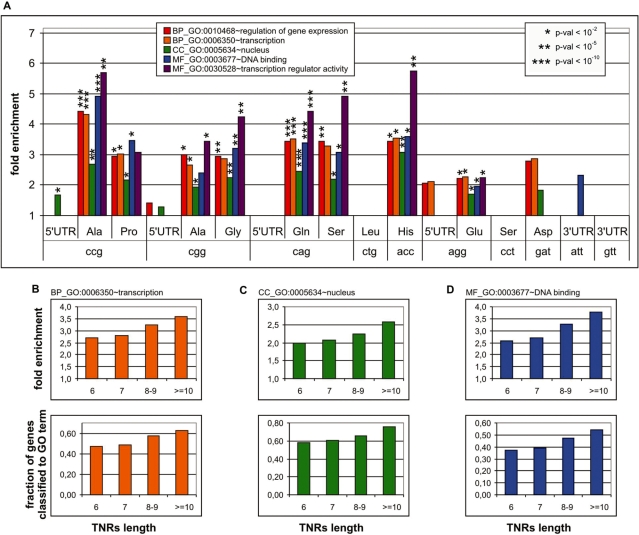
Trinucleotide repeats (TNRs) are of interest in genetics because they are used as markers for tracing genotype-phenotype relations and because they are directly involved in numerous human genetic diseases. In this study, we searched the human genome reference sequence and annotated exons (exome) for the presence of uninterrupted triplet repeat tracts composed of six or more repeated units. A list of 32 448 TNRs and 878 TNR-containing genes was generated and is provided herein. We found that some triplet repeats, specifically CNG, are overrepresented, while CTT, ATC, AAC and AAT are underrepresented in exons. This observation suggests that the occurrence of TNRs in exons is not random, but undergoes positive or negative selective pressure. Additionally, TNR types strongly determine their localization in mRNA sections (ORF, UTRs). Most genes containing exon-overrepresented TNRs are associated with gene ontology-defined functions. Surprisingly, many groups of genes that contain TNR types coding for different homo-amino acid tracts associate with the same transcription-related GO categories. We propose that TNRs have potential to be functional genetic elements and that their variation may be involved in the regulation of many common phenotypes; as such, TNR polymorphisms should be considered a priority in association studies.


Figures

Figure 1.
Figure 1.
Frequency of TNRs in the human genome and in exons. (A) The total number of TNRs (≥6 U) identified in the reference sequence of the human genome and in human exons. Different colors represent different TNR types and are used consistently throughout the article. (B) Representation rates of the 10 TNR types in human exons. Positive and negative values represent the fold over- and under-representation, respectively. The representation rate was calculated as the ratio of a TNR’s density (number of TNRs per 1 Mbp) in exons to its density in the entire genome including exons. For calculation, we have taken into account the total genome size and the fraction of the genome covered by exons annotated by RefSeq and/or UCSC nomenclature (2.75%). (C) Representation rates calculated separately for each orientation of each TNR type. In calculating these ratios, we assumed that both TNR orientations are represented equally in the genome (e.g. to calculate the representation rate for ccg, we divided the density of ccg in exons by the density of CGG in the genome divided by two). The symbols H and Q indicate TNRs for which RNA strands are capable of forming stable hairpin and quadruplex structures, respectively.
Figure 2.
Figure 2.
Length distributions of TNR types in the human genome and in exons. (A) For each type, the graph shows the number (y-axis) of TNRs of a given length (x-axis) identified in the human genome (color bars) and in exons (black bars). Bars indicated on the x-axis as >30 and 40 show the combined number of TNRs 31–40 and >40 U in length, respectively. An inset, shown in some graphs, was scaled up to emphasize the length distribution details specific for longer (less frequent) TNRs. (B) Heatmap graph showing the Kolmogorov–Smirnov statistic (D) for the pairwise length distribution comparisons of all TNR types. The color legend is shown next to the graph. The P-values for individual comparisons are also indicated on the graph (in each cell the value of the D statistic is given below). The P < 0.05 are indicated in red. The cluster of light blue squares represents groups of TNR types with similar length distributions. (C) Cumulative fraction plots comparing the TNR length distribution in exons (dashed line) and in non-exon sequences (genome sequence not covered by exons) (solid lines). The y-axis indicates the cumulative fraction of TNRs for certain TNR lengths (x-axis). The maximum distance between fraction plots (K–S-test, D statistic) and appropriate P-values are indicated on the plots.
Figure 3.
Figure 3.
Localization of TNRs in mRNA regions. (A) Bar-plot showing the number of TNRs in 5′-UTRs, ORFs and 3′-UTRs. (B) Pie plots showing the distribution of TNRs among mRNA regions separately for each TNR type and orientation. Subfractions of TNRs localized in ORFs coding specific AAs are also indicated. The percentage and the number (in brackets) of TNRs in each fraction are indicated.
Figure 4.
Figure 4.
Many different groups of TNR-containing genes are associated with transcription-related functions. (A) Bar plot showing the overrepresentation (y-axis) of representative transcription-related GO terms in all analyzed groups of TNR-containing genes. TNR type, mRNA localization and coded AA are indicated on the x-axis. The type and number of GO terms are indicated in the graph legend. The P-value for individual associations is indicated on the graph. (B–D) To test whether transcription-related association depends on TNR length, we divided all genes belonging to the transcription-associated group into four length-defined classes [6 U (N = 167), 7 U (64), 8–9 U (66) and ≥10 U (47)]. The classes were so defined to obtain comparable class sizes sufficient for GO analysis. The bar plots show the association of genes containing increasingly long TNRs with GO:0006350, transcription; GO:0005634, nucleus and GO:0003677, DNA binding terms. The upper and lower panels show fold enrichment and the fraction of genes classified as related to the various GO terms, respectively.
Figure 5.
Figure 5.
Genes with multiple TNRs. (A) Graph showing the number of genes with two or more TNRs. (B) The inset table characterizes the TNRs localized to genes containing the highest number (4 and 6) of TNRs. In the table, gene name, TNR type, TNR length, mRNA region, coded AA, genomic localization and genomic distance between successive TNRs are indicated. (C) Secondary structure of POU3F3 mRNA containing six TNRs (the simulation represents the lowest energy structure generated by the Mfold program).

References

    1. Gur-Arie R, Cohen CJ, Eitan Y, Shelef L, Hallerman EM, Kashi Y. Simple sequence repeats in Escherichia coli: abundance, distribution, composition, and polymorphism. Genome Res. 2000;10:62–71. - PMC - PubMed
    1. Toth G, Gaspari Z, Jurka J. Microsatellites in different eukaryotic genomes: survey and analysis. Genome Res. 2000;10:967–981. - PMC - PubMed
    1. Pumpernik D, Oblak B, Borstnik B. Replication slippage versus point mutation rates in short tandem repeats of the human genome. Mol. Genet. Genomics. 2008;279:53–61. - PubMed
    1. Kelkar YD, Tyekucheva S, Chiaromonte F, Makova KD. The genome-wide determinants of human and chimpanzee microsatellite evolution. Genome Res. 2008;18:30–38. - PMC - PubMed
    1. Madsen BE, Villesen P, Wiuf C. Short tandem repeats in human exons: a target for disease mutations. BMC Genomics. 2008;9:410. - PMC - PubMed

Publication types