. 2010 Jul;38(12):4011-26.
doi: 10.1093/nar/gkq112. Epub 2010 Mar 9.

Genome-wide analysis of YY2 versus YY1 target genes

Affiliations

Genome-wide analysis of YY2 versus YY1 target genes

Li Chen et al. Nucleic Acids Res. 2010 Jul.

Abstract

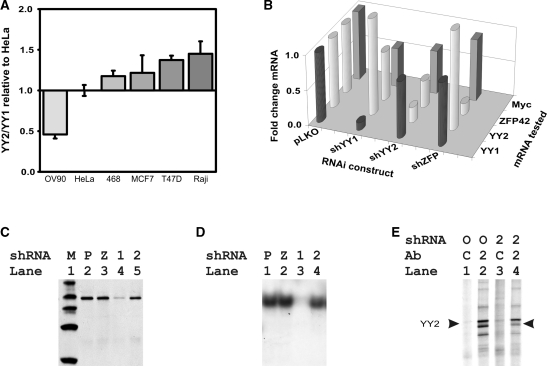
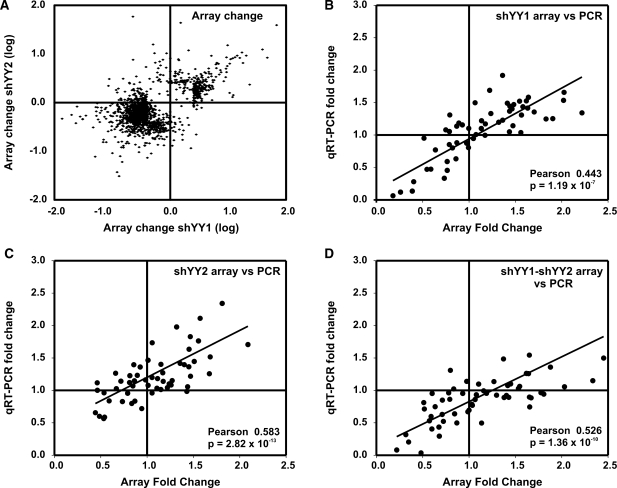
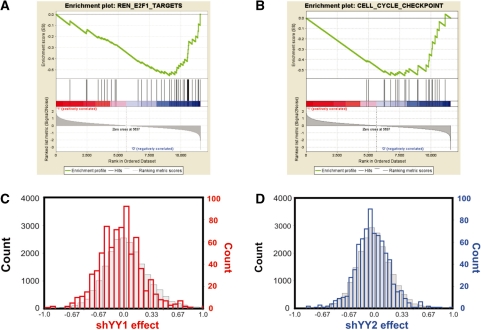
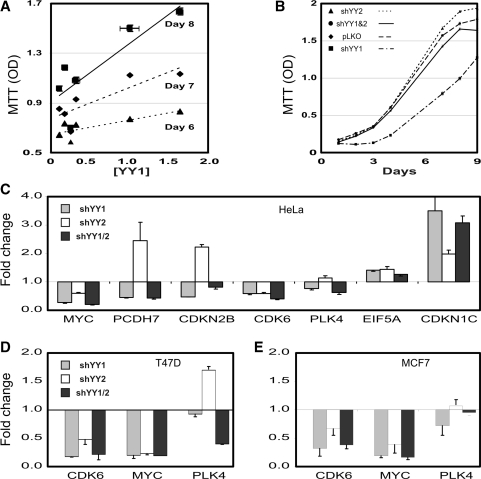
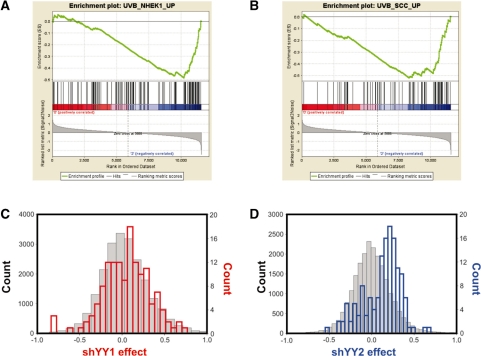
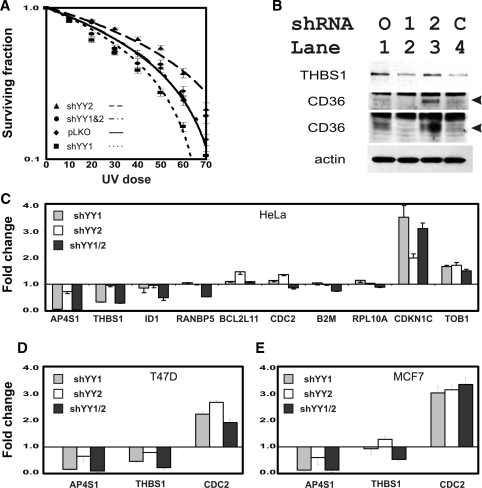
Yin Yang 1 (YY1) is a critical transcription factor controlling cell proliferation, development and DNA damage responses. Retrotranspositions have independently generated additional YY family members in multiple species. Although Drosophila YY1 [pleiohomeotic (Pho)] and its homolog [pleiohomeotic-like (Phol)] redundantly control homeotic gene expression, the regulatory contributions of YY1-homologs have not yet been examined in other species. Indeed, targets for the mammalian YY1 homolog YY2 are completely unknown. Using gene set enrichment analysis, we found that lentiviral constructs containing short hairpin loop inhibitory RNAs for human YY1 (shYY1) and its homolog YY2 (shYY2) caused significant changes in both shared and distinguishable gene sets in human cells. Ribosomal protein genes were the most significant gene set upregulated by both shYY1 and shYY2, although combined shYY1/2 knock downs were not additive. In contrast, shYY2 reversed the anti-proliferative effects of shYY1, and shYY2 particularly altered UV damage response, platelet-specific and mitochondrial function genes. We found that decreases in YY1 or YY2 caused inverse changes in UV sensitivity, and that their combined loss reversed their respective individual effects. Our studies show that human YY2 is not redundant to YY1, and YY2 is a significant regulator of genes previously identified as uniquely responding to YY1.


Figures

Figure 1.
Figure 1.
Altered expression of YY1 and YY2. (A) Copy numbers of YY1 and YY2 mRNAs in total RNA extracted from HeLa cells were compared with those in five other cell lines. Copy numbers were derived from qRT-PCR using plasmids pCEP4-FLAGYY1 and pCEP4-HAYY2 to provide standards. The YY2/YY1 copy number ratio was compared to that of HeLa and is plotted for each cell line. Standard deviations (SD) are shown, n = 3. The indicated cells are OV90, HeLa, MDA-MB-468 (468), MCF7, T47D and Raji cells. (B) shRNAs decreased YY family and Myc gene expression. The z-axis plots fold change between LKO-vector expressing control cells and the indicated shRNA identified along the x-axis. The y-axis identifies the mRNA assayed using qRT-PCR. (C) Western blots revealed reduced expression of YY1 in shYY1-treated cells (lane 4), but not in pLKO-, shZFP42- and shYY2-treated cells (lanes 2, 3, 5). Lane 1, MagicMark protein ladder (Invitrogen). (D) Electrophoretic mobility shift assay indicated loss of binding activity to the YY1-binding element in shYY1 treatment. Lane 1, pLKO vector treatment; Lane 2, shZFP42 treatment; Lane 3. shYY1 treatment; Lane 4. shYY2 treatment. (E) Immunoprecipitation of YY2 from 35S-methionine incorporated cells. Lanes 1 and 2, HeLa cells treated with control pLKO vectors; Lanes 3 and 4, HeLa cells treated with shYY2. Lanes 1 and 3, lysates were incubated with non-specific goat serum as antibody controls. Lanes 2 and 4, lysates were incubated with anti-YY2 antibodies. The indicated YY2-specific band migrates just under 60 kD, as expected.
Figure 2.
Figure 2.
Comparison of array versus qRT-PCR measurements of mRNA changes in cells expressing shYY1, shYY2 and shYY1/2. (A) Shown is a scatter plot comparing the effects of shYY1 to those of shYY2 in microarray experiments. We show mRNA signals that changed 2-fold or greater in the respective knock down cells from control cell levels. The x-axis plots the log of the change in the array signal comparing control pLKO cells to shYY1-expressing cells; the y-axis plots the log of the change in the arrays from control cells to shYY2-expressing cells for each probe. (B–D) We then developed primer sets for qRT-PCR analyses for 57 mRNAs identified from our microarray data as showing significant responses to knock down of YY1, YY2 and/or their combined knock down. (B) We show a scatter plot comparing microarray (x-axis) and qRT-PCR measurements (y-axis) of the mean fold change in expression of each gene comparing LKO-transduced control cells and cells expressing the shYY1 construct. The array data shows the mean for array data from all probe sets for each gene. The qRT-PCR shows the mean for three determinations for each gene. A Pearson correlation analysis was performed comparing the mean qRT-PCR result and the mean for each individual probe set for each gene. Shown is the Pearson correlation coefficient and the corresponding P-value. (C) We show a similar scatter plot as in A but we compare the array and qRT-PCR results for changes between LKO-control transduced cells and shYY2-expressing cells. (D) We show a similar scatter plot comparing control LKO-transduced cells and cells expressing both shYY1 and shYY2.
Figure 3.
Figure 3.
shYY1 and shYY2 effects on ribosomal protein mRNA expression. Gene Set Enrichment Analysis (GSEA) determines whether a defined set of genes shows concordant changes between two biological states. Enrichment scores (ES) are calculated by a running sum statistic, which increases for gene changes matching equivalent changes in compiled gene sets and decreases if changes were not seen for the given gene set. The enrichment plots shown here plot the concordance of ribosomal proteins mRNA changes with the ‘Ribosomal_Protein’ curated data set at: http://www.broad.mit.edu/gsea/msigdb/annotate.jsp. Shown are plots for shYY1 versus the LKO-vector-expressing cells (A). The enrichment score increments for every gene whose expression changes in response to shYY1 that is a ribosomal protein gene (hits). In this case, nearly all of the ribosomal protein mRNAs evaluated in these arrays increase in cells targeted by shYY1. In (B), cells expressing shYY2 show a similar response to YY2 knock down, although to a somewhat lesser extent. (C and D) Shown are histogram plots for the average change in the microarray signal for each of 198 ribosomal mRNAs compared with all other mRNA signals in the microarrays. The count (y-axis) shows the number of mRNAs deviating to the extent shown on the x-axis, which is the average deviation between the signal in the shYY arrays compared to the LKO vector control RNAs. [shYY1 and shYY2 effect shows fold change (ln) from control for the indicated bins.] The red histograms (C) show shYY1-induced changes and the blue histograms are for shYY2-induced changes (D). For the ribosomal protein mRNAs the y axes are on the right side of the plots. The grey histograms depict changes in all non-ribosomal protein mRNAs; their corresponding counts are in black on the left y axes. (E) qRT-PCR measurements of shYY1 and shYY2 effects on individual ribosomal protein mRNAs. We used qRT-PCR to evaluate the changes in 12 ribosomal mRNAS. Error bars demonstrate standard deviations, n = 3.
Figure 4.
Figure 4.
YY1- and YY2-specific target genes identified by microarrays were validated by qRT-PCR. (A), (C), (E), (G), (I), (K) were derived from microarray; panels (B), (D), (F), (H), (J), (L) depict qRT-PCR results plotted as fold change in mRNA levels between shRNA-expressing and control vector-expressing cells. The mRNAs assayed are identified by their gene names along the x axes of each plot, including measurements of YY1 and YY2 mRNAs. Columns graph the fold-change for the identified genes in cells expressing shYY1 (light gray bars), cells expressing shYY2 (open bars) and cells expressing shYY1/2 (dark gray bars). Error bars = SD, n = 3. (A), (B) Genes most affected by shYY1. (C), (D) Genes most affected by shYY2. (E), (F) Genes most downregulated by shYY1 and shYY2. (G), (H) Genes most upregulated by shYY1 and shYY2. (I), (J) Genes increased by shYY1 but decreased by shYY2. (K), (L) Genes decreased by shYY1 but increased by shYY2.
Figure 5.
Figure 5.
shYY1 and shYY2 target E2F-regulated mRNAs. (A and B) Shown are enrichment plots for two E2F target data sets that were most significantly affected by shYY1. The datasets included E2F targets from Ren et al. (43) and a curated set of cell-cycle genes. No plots are shown for shYY2 since it did not alter either E2F or cell-cycle sets. (C and D) Histograms demonstrating shYY1 and shYY2 effects on E2F target gene mRNAs were plotted as described for the ribosomal protein mRNAs. C was plotted as described for 3C, and D was plotted as described for 3D.
Figure 6.
Figure 6.
shYY1 and shYY2 altered cell proliferation rates. (A) Cell-proliferation rates correlated with YY1 expression level. Shown are cell densities (MTT OD) obtained on the indicated days versus the YY1 mRNA levels produced by each of five shYY1 vectors and the control vector. YY1 expression levels measured by qRT-PCR are plotted as fold change from the LKO vector control as [YY1]. Points for the various constructs were plotted using a linear regression plot to show the dose effect of YY1 loss versus the cell density achieved on each day. Error bars represent standard error of means (SEM), n = 16. All differences were significantly different by t-test. (B) Cell proliferation rates for cells expressing shRNA constructs. The cell densities achieved on the indicated days are plotted as the MTT OD value. Error bars = SEM, n = 24. Again differences were statistically significant on Days 7, 8 and 9 by t-test. (C) Fold change in mRNAs for selected E2F target genes affected by shYY1 and shYY2 were determined by qRT-PCR. Error bars represent SEM, n = 3. (D) T47D cells were transduced with the shYY1, shYY2 and combined shYY1 and shYY2 vectors. Gene-expression changes were determined using qRT-PCR by evaluating the fold-change in expression for three candidate genes comparing the knock down cells to control T47D cells transduced with the LKO vector alone. Shown are the mean and SEM, n = 3. (E) MCF7 cells were analyzed using qRT-PCR as described for the T47D cells and effects on the same three candidate target genes are graphed.
Figure 7.
Figure 7.
Gene sets that respond more to shYY2 than shYY1 include UV response genes. (A and B) Enrichment plots of two UV response gene sets targeted by shYY2 that were not affected by shYY1. These two data sets were derived from genome-wide comparisons of changes in gene expression in UV-irradiated keratinocytes (45). (C and D) Histogram counts of shYY1 (C) and shYY2 (D) effects on UV sensitive genes were plotted as in Figures 3 and 5.
Figure 8.
Figure 8.
shYY1 and shYY2 affect UV damage sensitivity. (A) Cell survival curves after UV exposure. Cells expressing vector control constructs, shYY1, shYY2 and combined shYY1/2 were exposed to UV radiation as described in methods. Irradiated cells were then plated in a standard survival curve analysis. Fraction survival at the indicated UV doses was calculated by dividing the cell density measured by MTT for the indicated dose by the cell density of untreated cells grown for the same time intervals. UV sensitivity is increased in shYY1 normalized in cells expressing both shYY1 and shYY2. Error bars = standard errors, n = 24 for each dose/construct combination. (B) Immunoblots for thrombospondin (THBS1) and CD36 confirmed that protein changes matched mRNA levels measured by qRT-PCR in Figure 4C and F. The CD36 immunoblot was performed twice using differing loading amounts and exposure times to highlight the differences between its levels in lanes 3 and 1 (top CD36) and lanes 4 and 2 (second CD36). Arrows indicate the CD36-specific band. An actin loading control is shown. (C) qRT-PCR confirms expression changes of UV-responsive genes affected by shYY1 and shYY2 in HeLa cells. Error bars = SEM, n = 3. (D and E) mRNA expression changes were confirmed using qRT-PCR for three candidate genes in the T47D and MCF7 cells transduced with the knock down constructs. Gene symbols are indicated along the x-axis and the fold-change for n = 3 are shown along the y-axis. We plot the means and SEM for each gene determination. Shown are T47D cells (D) and MCF7 cells (E).

Similar articles

Cited by

References

    1. Gordon S, Akopyan G, Garban H, Bonavida B. Transcription factor YY1: structure, function, and therapeutic implications in cancer biology. Oncogene. 2006;25:1125–1142. - PubMed
    1. Kohler C, Villar CB. Programming of gene expression by Polycomb group proteins. Trends Cell. Biol. 2008;18:236–243. - PubMed
    1. Schuettengruber B, Chourrout D, Vervoort M, Leblanc B, Cavalli G. Genome regulation by polycomb and trithorax proteins. Cell. 2007;128:735–745. - PubMed
    1. Denell RE. Homoeosis in Drosophila. I. Complementation studies with revertants of Nasobemia. Genetics. 1973;75:279–297. - PMC - PubMed
    1. Hormaeche I, Licht JD. Chromatin modulation by oncogenic transcription factors: new complexity, new therapeutic targets. Cancer Cell. 2007;11:475–478. - PubMed

Publication types

MeSH terms