. 2010 Jun;38(11):e120.
doi: 10.1093/nar/gkq149. Epub 2010 Mar 9.

Transcription factor regulation can be accurately predicted from the presence of target gene signatures in microarray gene expression data

Affiliations

Transcription factor regulation can be accurately predicted from the presence of target gene signatures in microarray gene expression data

Ahmed Essaghir et al. Nucleic Acids Res. 2010 Jun.

Abstract

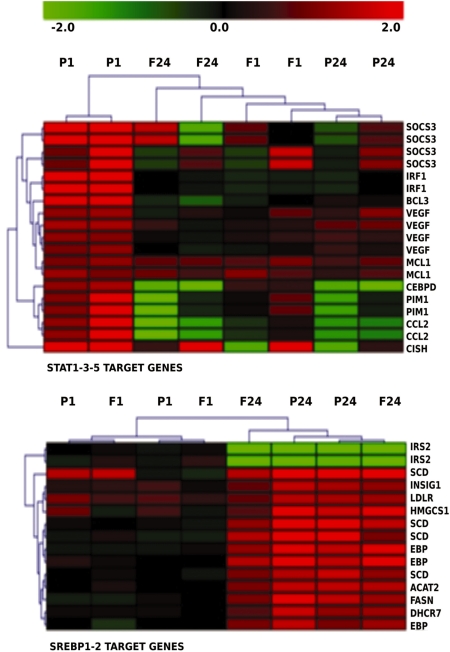
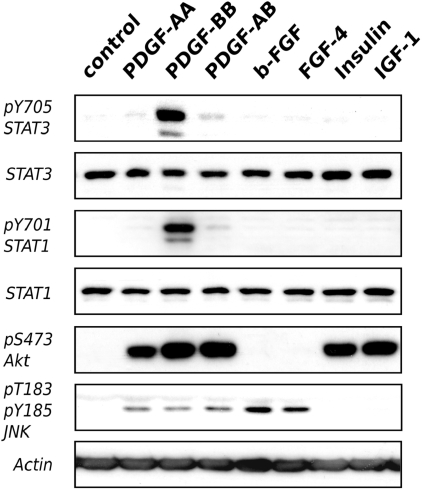
Deciphering transcription factor networks from microarray data remains difficult. This study presents a simple method to infer the regulation of transcription factors from microarray data based on well-characterized target genes. We generated a catalog containing transcription factors associated with 2720 target genes and 6401 experimentally validated regulations. When it was available, a distinction between transcriptional activation and inhibition was included for each regulation. Next, we built a tool (www.tfacts.org) that compares submitted gene lists with target genes in the catalog to detect regulated transcription factors. TFactS was validated with published lists of regulated genes in various models and compared to tools based on in silico promoter analysis. We next analyzed the NCI60 cancer microarray data set and showed the regulation of SOX10, MITF and JUN in melanomas. We then performed microarray experiments comparing gene expression response of human fibroblasts stimulated by different growth factors. TFactS predicted the specific activation of Signal transducer and activator of transcription factors by PDGF-BB, which was confirmed experimentally. Our results show that the expression levels of transcription factor target genes constitute a robust signature for transcription factor regulation, and can be efficiently used for microarray data mining.


Figures

Figure 1.
Figure 1.
Data integration in TFactS catalogs.
Figure 2.
Figure 2.
SOX10, MITF and JUN transcription factors are regulated in melanoma and associated with mutations in RAS and RAF. E-values of TFactS-predicted TF regulations for each NCI60 cell line are transformed into scores [−log10(E-value)]. These scores were plotted by cancer type (A) or by pathway mutations (B) for SOX10, MITF and JUN. Mutations clustered into RAF-RAS pathway targeted BRAF, KRAS, HRAS and NRAS. P-values were obtained by Kruskal–Wallis test (A) and Student’s t-test (B). WT, ‘wild type’; MUT, ‘mutant’; BR, breast; CNS, central nervous system; CO, colon; LC, lung cancer; LE, leukemia; ME, melanoma; OV, ovarian; PR, prostate; RE, renal.
Figure 3.
Figure 3.
STAT1 and STAT3 are phosphorylated in EOL1 cells and inhibited by imatinib. (A) STAT activation Benjamini-Hochberg corrected P-values predicted by TFactS. (B) Cell lysates from imatinib-treated or control EOL1 cells were used in western blot probed with antibodies against phospho-STAT3 and phospho-STAT1. As a control, we used antibodies against total STAT3 and STAT1.
Figure 4.
Figure 4.
Hierarchical clustering of STAT or SREBP target genes significantly regulated by PDGF-BB and b-FGF in human fibroblasts. STAT(1, 3 and 5) target gene signatures were pooled as well as SREBP(1 and 2) target genes. Several reports have shown that IRS2 gene expression is downregulated by SREBP while other targets are up-regulated . The intensities are in log2 ratios (color scale). Two replicate experiments are shown. F1, b-FGF(1 h); F24, b-FGF(24 h); P1, PDGF-BB(1 h); P24, PDGFBB(24 h).
Figure 5.
Figure 5.
STAT phosphorylation is specifically induced by PDGF-BB. Human fibroblasts were starved for 48 h in serum-free medium and stimulated with the indicated growth factors for 15 min. Total cell lysate was used for western blot with antibodies against specific phospho-STAT, phospho-JNK, phospho-AKT, total STAT and total JNK as indicated. Actin was detected as a control.

References

    1. Subramanian A, Tamayo P, Mootha VK, Mukherjee S, Ebert BL, Gillette MA, Paulovich A, Pomeroy SL, Golub TR, Lander ES, et al. Gene set enrichment analysis: a knowledge-based approach for interpreting genome-wide expression profiles. Proc. Natl Acad. Sci. USA. 2005;102:15545–15550. - PMC - PubMed
    1. Defrance M, Touzet H. Predicting transcription factor binding sites using local over-representation and comparative genomics. BMC Bioinformatics. 2006;7:396. - PMC - PubMed
    1. Hestand MS, van Galen M, Villerius MP, van Ommen GJ, den Dunnen JT, 't Hoen PA. CORE_TF: a user-friendly interface to identify evolutionary conserved transcription factor binding sites in sets of co-regulated genes. BMC Bioinformatics. 2008;9:384. - PMC - PubMed
    1. Liu CC, Lin CC, Chen W.SE, Chen HY, Chang PC, Chen J.JW, Yang PC. CRSD: a comprehensive web server for composite regulatory signature discovery. Nucleic Acids Res. 2006;34:W571–W577. - PMC - PubMed
    1. Ho Sui SJ, Mortimer JR, Arenillas DJ, Brumm J, Walsh CJ, Kennedy BP, Wasserman WW. oPOSSUM: identification of over-represented transcription factor binding sites in co-expressed genes. Nucleic Acids Res. 2005;33:3154–3164. - PMC - PubMed

Publication types