. 2010 Mar;22(3):888-903.
doi: 10.1105/tpc.109.071779. Epub 2010 Mar 9.

The Arabidopsis thaliana Myo-inositol 1-phosphate synthase1 gene is required for Myo-inositol synthesis and suppression of cell death

Affiliations

The Arabidopsis thaliana Myo-inositol 1-phosphate synthase1 gene is required for Myo-inositol synthesis and suppression of cell death

Janet L Donahue et al. Plant Cell. 2010 Mar.

Abstract

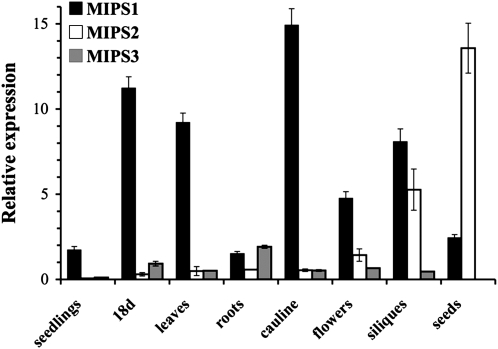
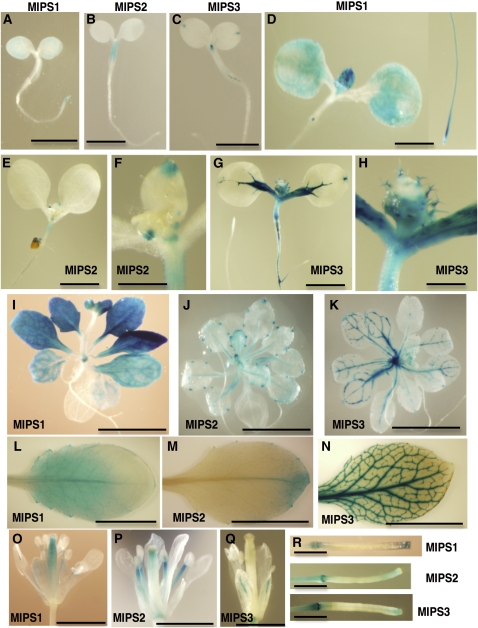
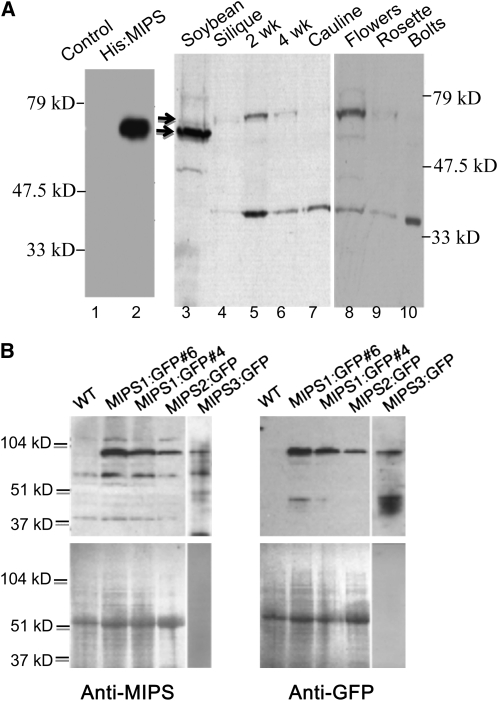
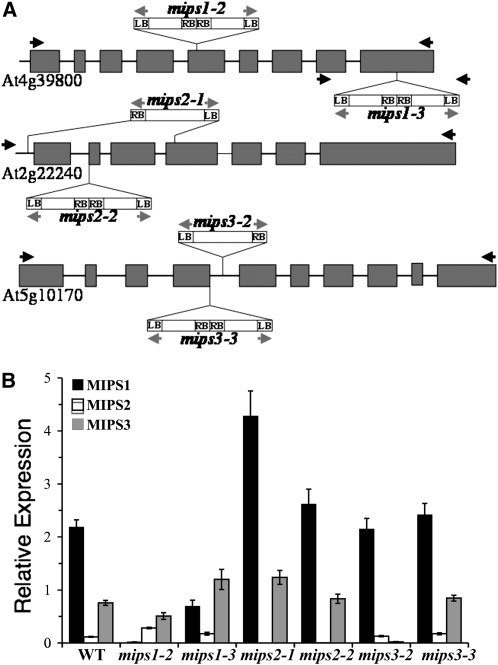
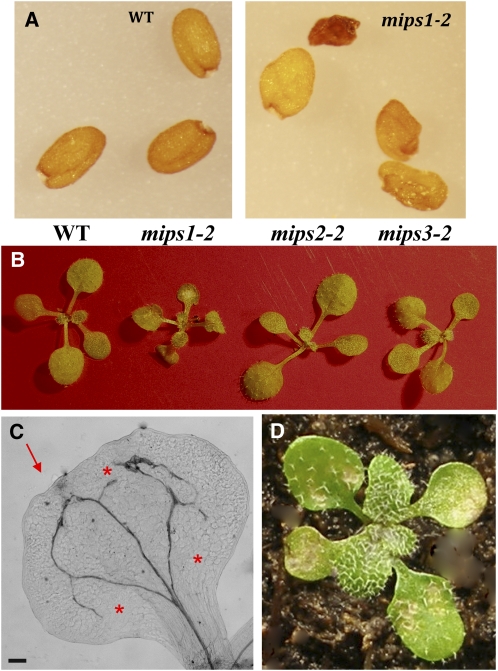
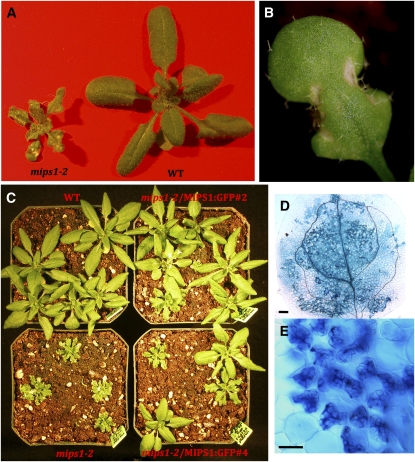
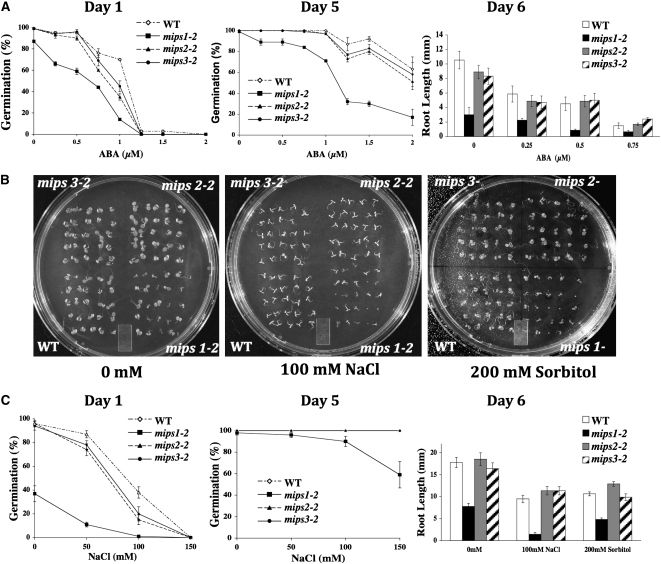
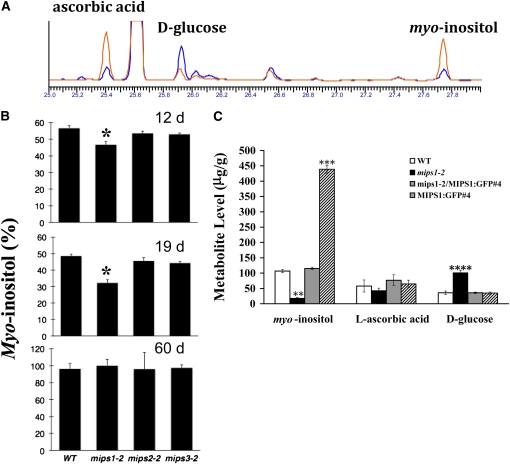
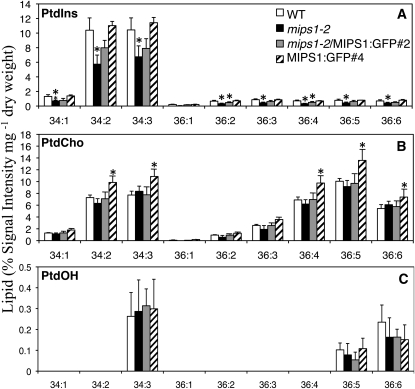
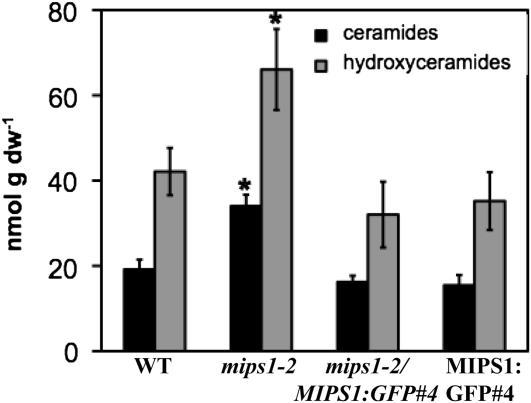
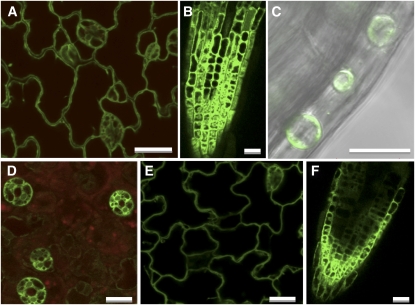
l-myo-inositol 1-phosphate synthase (MIPS; EC 5.5.1.4) catalyzes the rate-limiting step in the synthesis of myo-inositol, a critical compound in the cell. Plants contain multiple MIPS genes, which encode highly similar enzymes. We characterized the expression patterns of the three MIPS genes in Arabidopsis thaliana and found that MIPS1 is expressed in most cell types and developmental stages, while MIPS2 and MIPS3 are mainly restricted to vascular or related tissues. MIPS1, but not MIPS2 or MIPS3, is required for seed development, for physiological responses to salt and abscisic acid, and to suppress cell death. Specifically, a loss in MIPS1 resulted in smaller plants with curly leaves and spontaneous production of lesions. The mips1 mutants have lower myo-inositol, ascorbic acid, and phosphatidylinositol levels, while basal levels of inositol (1,4,5)P(3) are not altered in mips1 mutants. Furthermore, mips1 mutants exhibited elevated levels of ceramides, sphingolipid precursors associated with cell death, and were complemented by a MIPS1-green fluorescent protein (GFP) fusion construct. MIPS1-, MIPS2-, and MIPS3-GFP each localized to the cytoplasm. Thus, MIPS1 has a significant impact on myo-inositol levels that is critical for maintaining levels of ascorbic acid, phosphatidylinositol, and ceramides that regulate growth, development, and cell death.


Figures

Figure 1.
Figure 1.
Relative Expression of MIPS Genes as Determined by Quantitative RT-PCR. MIPS1, MIPS2, and MIPS3 gene expression was measured in 7-d-old wild-type seedlings grown on 0.5× MS-soaked filter paper under 16-h-light conditions (seedlings), soil-grown 18-d-old whole plants (18 d), young rosette leaves (leaves), roots, cauline leaves (cauline), and flowers from 25-d-old plants, immature siliques (siliques), and seeds imbibed in water for 3 d at 4°C. Real-time PCR amplification curves (see Methods) were compared with standard curves and PEX4 amplification to generate relative expression levels. Means of triplicate reactions ± se are presented.
Figure 2.
Figure 2.
Spatial Expression Patterns of MIPS Genes. The promoters from MIPS1, MIPS2, or MIPS3 were used to drive GUS expression in transgenic plants. (A) to (C) Three-day-old seedlings grown on 0.5× MS. Bars = 2 mm. (D) to (H) Seven-day-old seedlings grown on 0.5× MS plus 1% sucrose. Bars = 2 mm in (D), (E), and (G) and 0.5 mm in (F) and (H). (I) to (K) Nineteen-day-old plants grown on 0.5× MS plus 1% sucrose. Bars = 5 mm. (L) to (R) Organs from soil-grown plants. (L) to (N) Leaves. Bars = 1 cm. (O) to (Q) Flowers. Bars = 2 mm. (R) Immature siliques. Bars = 2 mm.
Figure 3.
Figure 3.
Expression of MIPS Proteins. (A) Denaturing SDS-PAGE and protein gel blot analysis of bacterial (lanes 1 and 2) and plant extracts (lanes 3 to 10) with anti-MIPS antibody. The arrows mark migration of soybean (lane 3) and Arabidopsis MIPS proteins (lanes 4 to 10). (B) The MIPS antibody cross-reacts with all three MIPS-GFP fusion proteins. Protein extracts of wild-type and MIPS1-GFP seedlings, MIPS2-GFP rosette leaves, and MIPS3-GFP roots. The anti-MIPS antibody was used in the left panel, and the anti-GFP antibody in the right panel. Ponceau S staining of the blots is shown in the bottom two panels.
Figure 4.
Figure 4.
T-DNA Insertions and Mutant Gene Expression. (A) Schematic of T-DNA insertion sites in the mips1-2, mips2-2, mips2-1, mips2-2, mips3-2, and mips3-3 mutants. Exons are shown as dark-gray boxes; the gray arrows indicate primers used to amplify the right border (RB) and left border (LB) of the T-DNA; black arrows indicate the positions of gene-specific primers. (B) Expression levels of MIPS1, MIPS2, and MIPS3 genes in 21-d-old wild-type and mutant plants. Real-time PCR amplification curves (see Methods) were compared with standard curves and PEX4 amplification to generate relative expression levels. Before normalization to PEX4, wild-type levels were as follows: MIPS1, 1.6 ± 0.03 fmol per μg RNA; MIPS2, 0.087 ± 0.025; MIPS3, 0.57 ± 0.009; and PEX4, 0.75 ± 0.013 fmol per μg RNA. Means of quadruplicate reactions ± se are represented. Asterisks indicate significant difference from the wild type (P < 0.01) in a Student's t test.
Figure 5.
Figure 5.
Alterations in Seed and Cotyledon Morphology in mips1 Mutants. (A) Seed phenotypes of the wild type and mips1 mutants. (B) Seedling phenotypes of the wild type and mips mutants. (C) Cleared cotyledon from the mips1-2 mutant. The arrow indicates the irregular cotyledon margin. The asterisks indicate areas where cotyledon vascular loops have not closed. Bar = 125 μm. (D) mips1-3 seedling containing irregular cotyledons and lesions.
Figure 6.
Figure 6.
A MIPS1-GFP Gene Complements the Cell Death–Associated Phenotypes of mips1 Mutants. (A) Soil-grown mips1-2 (left) and wild-type (CS60000) plants. (B) Leaf containing lesions from mips1-2 plants. (C) Segregation of progeny from heterozygous mips1-2 plants containing a 35Spromoter-MIPS1-GFP transgene. (D) and (E) Trypan blue staining of mips1-2 cotyledons. Bar = 100 μm in (D) and 40 μm in (E).
Figure 7.
Figure 7.
Physiological Responses in mips Mutants. (A) Effects of ABA on germination and root length of the wild type and mips mutants grown on agar plates. (B) Photos of 7-d-old wild-type and mips mutant seedlings grown for germination studies on agar plates with the indicated additions. (C) Effects of NaCl and sorbitol on germination and root length of the wild type and mips mutants grown on agar plates. Presented are means ± se of four experiments of n = 25 (germination) and five experiments of n = 6 (root length).
Figure 8.
Figure 8.
Myo-Inositol Metabolic Alterations in mips Mutants. (A) Overlay of representative GC traces from mips1-2 (blue) and wild-type plants (red). (B) Leaves of 12-, 19-, and 60-d-old wild-type, mips1-2, mips2-2, and mips3-2 plants were harvested, and myo-inositol levels were quantified with GC as described in Methods. Values are percent of maximal levels. Standard error is indicated (n = 3). Asterisk indicates a P value < 0.05. (C) Whole 18-d-old plants were harvested, and the indicated metabolites were quantified with GC as described in Methods. **, P value < 0.001; ***, P value < 0.0005.
Figure 9.
Figure 9.
Lipid Levels in mips Mutants, Complemented Mutants, and MIPS-GFP Plants. Mass spectrometry was used to measure different species of PtdIns (A), phosphatidylcholine (PtdCho) (B), and phosphatidic acid (PtdOH) (C). Phospholipids are listed according to the carbon number followed by the number of double bonds. Data from three independent biological replicates were averaged. The standard error is indicated. Asterisk indicates a P value < 0.05 compared with the wild type.
Figure 10.
Figure 10.
Ceramide and Hydroxyceramide Levels Are Increased in mips Mutants. Sphingolipids were extracted from leaves of 18-d-old plants of the indicated genotypes and measured essentially as described previously (Markham and Jaworski, 2007). Means and se are presented. Data from three independent biological replicates were averaged. The sd is indicated. Asterisk indicates a P value < 0.05 compared with the wild type. dw, dry weight.
Figure 11.
Figure 11.
Subcellular Location of MIPS1-, MIPS2-, and MIPS3-GFP Proteins. Single optical sections of transgenic plants expressing MIPS1-GFP ([A] to [C]), MIPS2-GFP (D), and MIPS3-GFP ([E] and [F]). Epidermal cells in cotyledon ([A], [D], and [E]), root ([B] and [F]), and differential interference contrast overlay of plasmolyzed cells within the hypocotyl with GFP fluorescence (C). (D) also includes autofluorescence from chlorophyll (red). Bars = 20 μm.

Comment in

Similar articles

Cited by

References

    1. Alcazar-Roman A.R., Tran E.J., Guo S., Wente S.R. (2006). Inositol hexakisphosphate and Gle1 activate the DEAD-box protein Dbp5 for nuclear mRNA export. Nat. Cell Biol. 8: 711–716 - PubMed
    1. Alcazar-Roman A.R., Wente S.R. (2008). Inositol polyphosphates: A new frontier for regulating gene expression. Chromosoma 117: 1–13 - PubMed
    1. Allison J.H., Stewart M.A. (1973). Myo-inositol and ascorbic acid in developing rat brain. J. Neurochem. 20: 1785–1788 - PubMed
    1. Alonso J.M., et al. (2003). Genome-wide insertional mutagenesis of Arabidopsis thaliana. Science 301: 653–657 - PubMed
    1. Baig M.M., Kelly S., Loewus F. (1970). L-ascorbic acid biosynthesis in higher plants from L-gulono-1, 4- lactone and L-galactono-1, 4-lactone. Plant Physiol. 46: 277–280 - PMC - PubMed

Publication types

MeSH terms