. 2010 Mar;22(3):755-71.
doi: 10.1105/tpc.109.071746. Epub 2010 Mar 9.

Arabidopsis homologs of nucleus- and phragmoplast-localized kinase 2 and 3 and mitogen-activated protein kinase 4 are essential for microtubule organization

Affiliations

Arabidopsis homologs of nucleus- and phragmoplast-localized kinase 2 and 3 and mitogen-activated protein kinase 4 are essential for microtubule organization

Martina Beck et al. Plant Cell. 2010 Mar.

Abstract

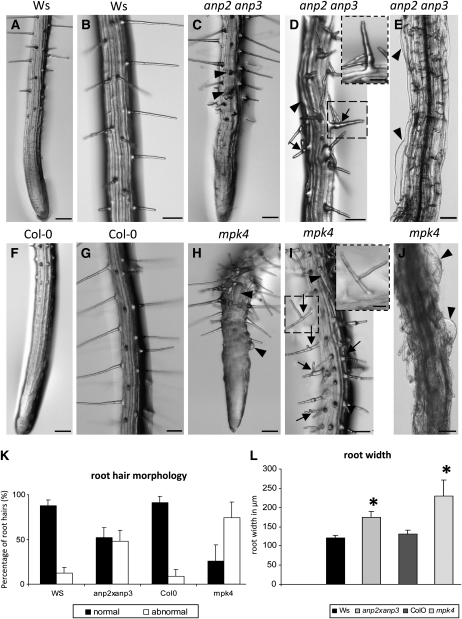
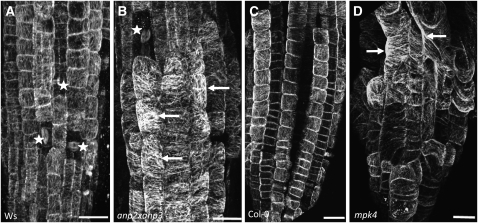
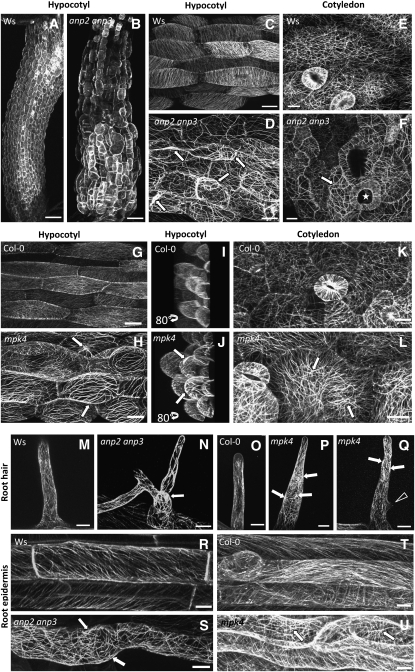
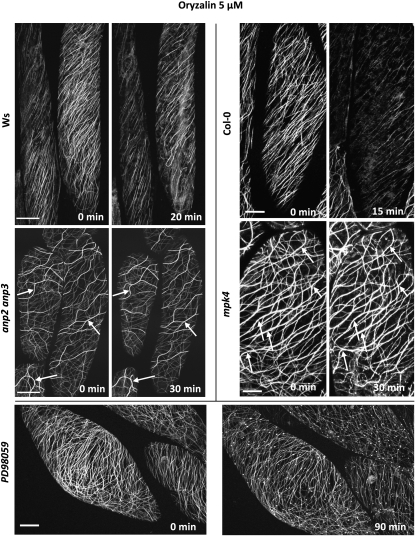
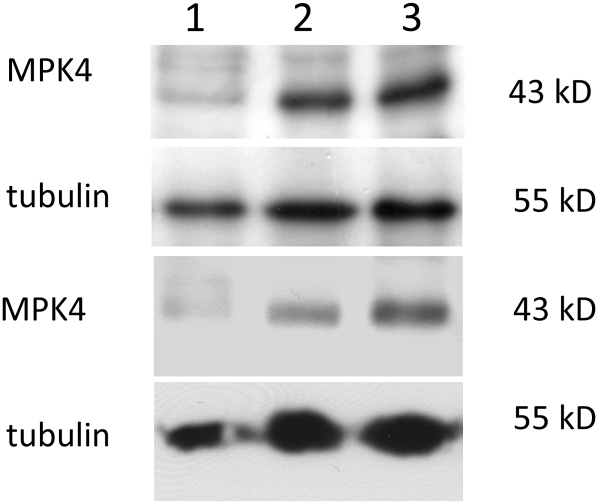
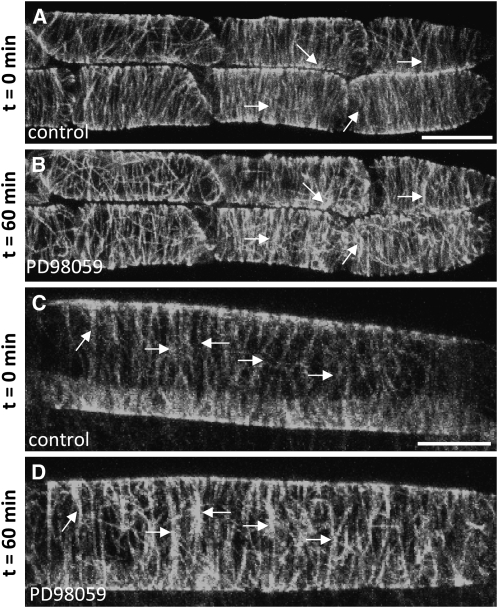
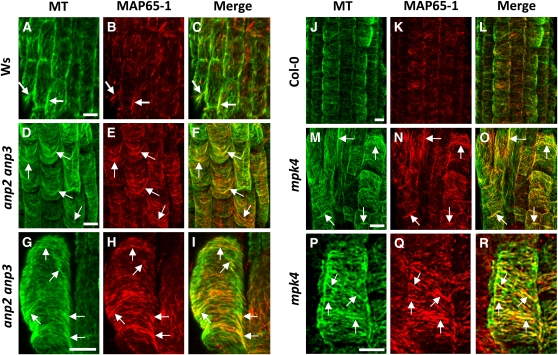
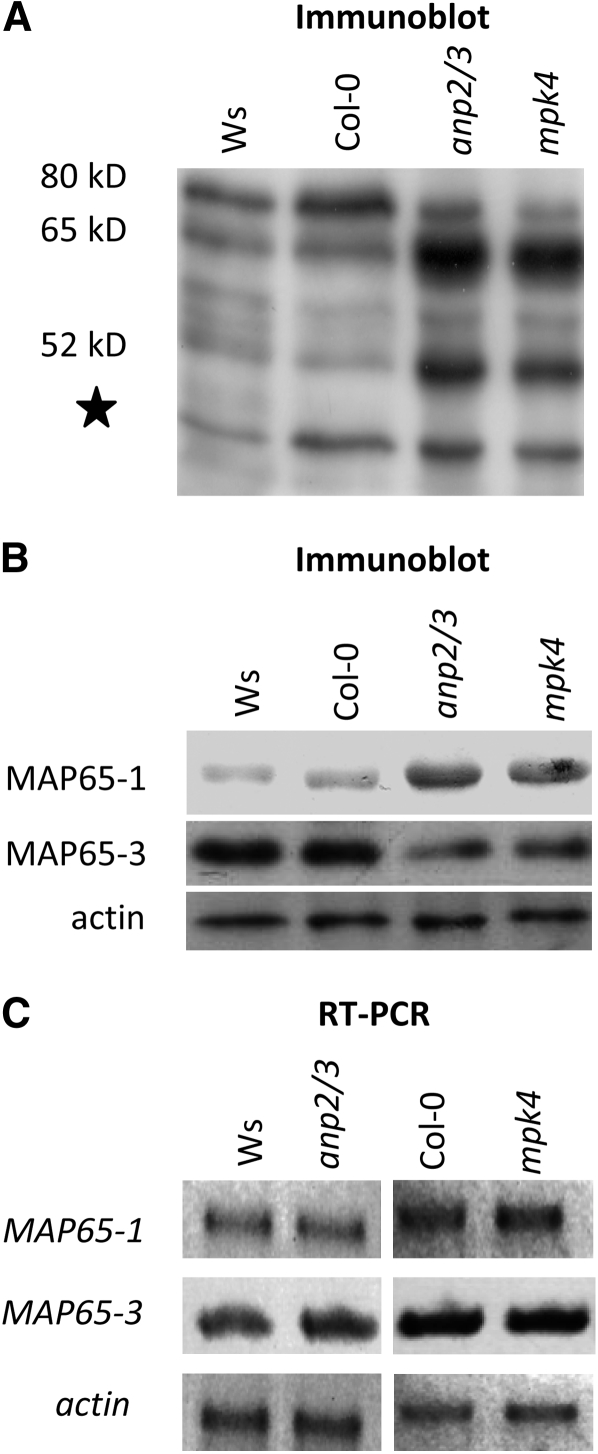
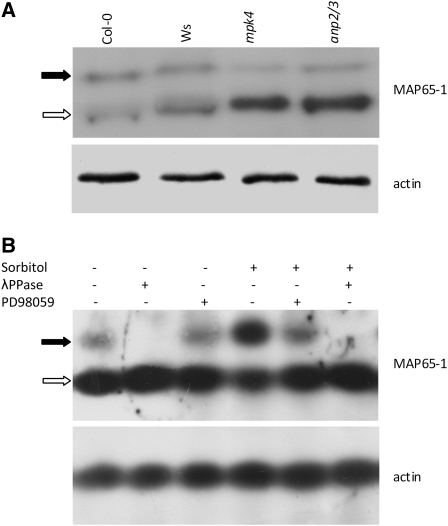
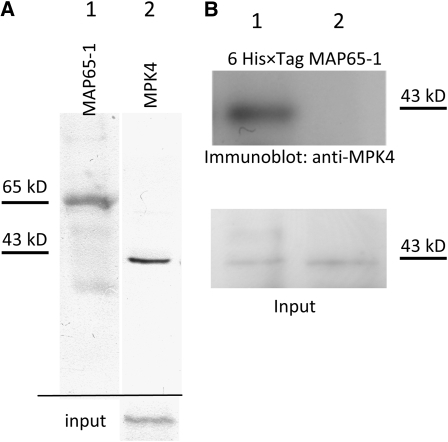
A double homozygous recessive mutant in the Arabidopsis thaliana homologs of nucleus- and phragmoplast-localized kinase 2 (ANP2) and 3 (ANP3) genes and a homozygous recessive mutant in the mitogen-activated protein kinase 4 (MPK4) gene of Arabidopsis exhibit deficiencies in the overall microtubule (MT) organization, which result in abnormal cell growth patterns, such as branching of root hairs and swelling of diffusely growing epidermal cells. Genetic, pharmacological, molecular, cytological, and biochemical analyses show that the major underlying mechanism for these phenotypes is excessive MT stabilization manifested in both mutants as heavy MT bundling, disorientation, and drug stability. The above defects in MAPK signaling result in the adverse regulation of members of the microtubule-associated protein (MAP65) protein family, including strongly diminished phosphorylation of MAP65-1. These data suggest that ANP2/ANP3, MPK4, and the microtubule-associated protein MAP65-1, a putative target of MPK4 signaling, are all essential for the proper organization of cortical microtubules in Arabidopsis epidermal cells.


Figures

Figure 1.
Figure 1.
Root Phenotype Comparisons among Ws, anp2 anp3, Col-0, and mpk4. (A) to (E) Roots of Ws plants showing smooth root outline and straight-growing root hairs ([A] and [B]). By contrast, roots of the anp2 anp3 mutant ([C] and [E]) appear radially swollen with bulging epidermal cells (arrowheads) and bear branched root hairs (arrows). Inset in (D) shows detail on branched root hair in the indicated boxed area. Bars = 100 μm; 30 μm for the inset. (F) to (J) Normal root morphology in the control (Col-0) plant ([F] and [G]) and highly abnormal root morphology of the mpk4 mutant ([H] to [J]) showing radial swelling of epidermal cells (arrowheads) and branching of root hairs (arrows). Inset in (I) shows detail on branched root hair in the indicated box area. Bars = 100 μm; 30 μm for the inset. (K) Graphic depiction of the percentage of branched or otherwise abnormal root hairs in anp2 anp3 and mpk4 seedlings compared with control Ws and Col-0 seedlings, respectively. Note that 76% of root hairs in mpk4 seedlings and 48% of root hairs in anp2 anp3 seedlings are branched and/or deformed. Only 9 and 11% of branched root hairs could be found in Col-0 and Ws control plants, respectively. (L) Graphic depiction of root width in micrometers of anp2 anp3 and mpk4 seedlings compared with control Ws and Col-0 seedlings, respectively. Both mutants show increased root width, more strongly affected in the mpk4 mutant. Values are for Ws, 122.09 μm ± 9 (sd); anp2 anp3, 173.53 μm ± 21.92 (sd); Col-0: 129.875 μm ± 12.38 (sd); and mpk4, 224 μm ± 42.77 (sd). Asterisks indicate statistically significant difference between mutants and corresponding controls as revealed by Student's t test (P < 0.05).
Figure 2.
Figure 2.
In Situ Localization of MTs in anp2 anp3 and mpk4 Mutants. Immunofluorescence localization of MTs in roots of Ws (A), anp2 anp3 (B), Col-0 (C), and mpk4 (D) plants. Arrows indicate examples of thick and deregulated MT bundles in both mutants. Asterisks denote mitotic cells. Bars = 10 μm
Figure 3.
Figure 3.
In Vivo Localization of MTs in Hypocotyls, Cotyledons, and Roots Using the 35S:GFP:MBD Reporter Construct in anp2 anp3 and mpk4 Mutants. (A) to (F) In vivo visualization of cortical MT organization using the 35S:GFP:MBD construct and confocal laser scanning microscopy (CLSM) imaging in the hypocotyl and cotyledon of control (Ws) and anp2 anp3 mutant plants. Disturbed patterns of cortical MT organization in hypocotyl and cotyledon cells of the anp2 anp3 mutant as visualized in vivo using the 35S:GFP:MBD construct. Note the extensive MT bundling as well as irregular and wavy configuration of the MT bundles ([D] and [F], arrows). Irregularly formed and swollen cells are apparent in the hypocotyl ([B] and [D]) and cotyledon ([F], star). Bars = 20 μm. (G) to (L) In vivo visualization of cortical MT organization using the 35S:GFP:MBD construct and CLSM imaging in the hypocotyl and cotyledon of control (Col-0) and mpk4 mutant plants. Bundling of MTs in the cortex of hypocotyl and cotyledon cells ([H], [J], and [L]) in mpk4 plants. Projection of hypocotyl cells, rotated by an angle of 80° to provide a lateral view ([I] and [J]). The cell volume of mpk4 plants is significantly larger than that of Col-0. Arrows point to thick cortical MT bundles. Projection of 52 optical sections at a 0.65-μm step size (I); z = 33.8 μm. Projection of 96 optical sections at a 0.65-μm step size (J); z = 62 μm Bars = 20 μm. (M) to (Q) In vivo visualization of MT organization using the 35S:GFP:MBD construct and CLSM imaging in root hairs of control (Ws and Col-0) and mutant (anp2 anp3 and mpk4) plants. Mutant root hairs with abnormal morphology, branched ([N] and [Q], arrowhead), or swollen root hair bases (P) showing MT bundles (arrows) or disturbed MT orientation compared with wild-type root hairs ([M] and [O]). Bars = 10 μm. (R) to (U) In vivo visualization of cortical MT organization using the 35S:GFP:MBD construct and CLSM imaging in root epidermal cells of control (Ws and Col-0) and mutant (anp2 anp3 and mpk4) plants. Patterns of cortical MT organization were disturbed in both mutants ([S] and [U], arrows). Bars = 20 μm.
Figure 4.
Figure 4.
The Time-Dependent Response of Hypocotyl Epidermal Cells of 35S:GFP:MBD-Transformed Ws/Col-0 and anp2 anp3/mpk4 Plants Treated with 5 μM Oryzalin or with 20 μM PD98059 and 5 μM Oryzalin. Note the severe depletion of cortical MTs in oryzalin-treated Ws and Col-0 hypocotyl epidermal cells after 20 min. By contrast, both individual MTs and/or MT bundles (arrows) persist in anp2 anp3 and mpk4 hypocotyl epidermal cells at least over a period of 30 min. In cells treated for 6 h with the MAPKK inhibitor PD98059 and subsequently with oryzalin plus PD98059, cortical MTs appear heavily bundled and randomly dispersed in the cell cortex, while remaining resistant to oryzalin treatment for at least 90 min. Time (in minutes) is indicated in the bottom right corner. Bars = 10 μm.
Figure 5.
Figure 5.
Association of MPK4 with the MT Surface. Analysis of MT pellets from Arabidopsis extracts supplemented with exogenous bovine brain MTs (10 μM tubulin). Lane 1 shows the occurrence of MPK4 in the original supernatant (see Methods). Lanes 2 and 3 show the occurrence of MPK4 in the final MT pellets following the last glycerol cushion precipitation. In lane 3, the reaction mixture was supplemented with 10 μM 6×His-tagged MAP65-1. No significant difference can be detected in the efficiency of MPK4 coprecipitation in the presence or absence of MAP65-1. The bottom two rows show the same experiment in the absence of the glycerol cushion, which greatly enriches the amount of tubulin (bottom panel).
Figure 6.
Figure 6.
Effects of MAPKK Inhibitor PD98059 on Cortical MT Organization. In vivo visualization of MTs in root epidermal cells of Col-0 plants stably transformed with 35S:GFP:MBD construct. Arrows show examples of cortical MTs, which are aggregated into bundles at the end of the PD98059 treatment. Bars = 10 μm. (A) and (C) Untreated control epidermal cells showing fine MTs of parallel orientation. (B) and (D) The same cells as in (A) and (C) showing bundled and accumulated MTs in the cell cortex after 60 min treatment with PD98059 (20 μM).
Figure 7.
Figure 7.
TEM Visualization of MT Organization in the Cortical Cytoplasm of Ws and the Cell Cortex or the Endoplasm of anp2 anp3 Hypocotyl Epidermal Cells. MTs are regularly spaced and loosely arranged in the vicinity of the plasma membrane in wild-type cells ([A], arrows). MTs are densely packed and/or cross-linked in the cortical cytoplasm or the endoplasm in anp2 anp3 cells ([B] and [C]). Black arrows denote cross-bridged MTs. CW, cell wall. Bars = 100 nm in (A) and 50 nm in (B) and (C).
Figure 8.
Figure 8.
Patterns of MAP65-1 and Tubulin Immunofluorescence Localization in Roots of Control and Mutant Plants. (A) to (C) Localization of MTs (green), MAP65-1 (red), and merged images in root epidermal cells of Ws. Note the partial spot-like colocalization of MAP65-1 with cortical MTs and the more extensive MAP65-1 decoration of certain MT bundles (arrows). (D) to (F) The colocalization of MAP65-1 with bundled MTs (note increased yellow color in merged images) in root epidermal cells of anp2 anp3 is much more extensive than in Ws (cf. Figure 9C), an observation consistent with the extensive cortical MT bundling found in this mutant. Arrows point to bundled MTs. (G) to (I) Detailed visualization of the decoration of MTs by MAP65-1 in root epidermal cells of anp2 anp3 showing extensive association of MAP65-1 with MT bundles (yellow color in merged image), often throughout their entire length. (J) to (L) Overview of the localization of tubulin (green), MAP65-1 (red), and merged images in root epidermal cells of Col-0. Arrows point to bundled MTs. (M) to (O) Overview of MAP65-1 distribution along cortical MTs in mpk4 root epidermal cells. Note increased yellow color in merged image, suggesting extensive colocalization of MAP65-1 and bundled MTs in this mutant (arrows). (P) to (R) Detailed view of MAP65-1 localization in mpk4 root epidermal cells showing extensive association of MAP65-1 with MT bundles over their entire length (arrows). Bars = 10 μm.
Figure 9.
Figure 9.
Comparative Analysis of MAP65 Isoform Composition and Expression Levels. (A) and (B) General immunoblot survey of MAP65 isoform composition detectable with an anti-CEEESWLEDYNR antibody (A) or with isoform-specific anti-MAP65-1 and anti-MAP65-3 antibodies (B) showing quantitative upregulation of the MAP65-1 and downregulation of the MAP65-3 in both the anp2 anp3 and the mpk4 mutants compared with the respective Ws and Col-0 controls. Numbers indicate molecular mass in kilodaltons. The star denotes a band probably corresponding to a degradation product of MAP65. Anti-actin staining was used as a loading control (B). (C) RT-PCR analysis of MAP65-1 and MAP65-3 transcript levels (26 amplification cycles) showing no visible differences between Ws, anp2 anp3, Col-0, and mpk4 plants. ACTIN2 transcript (26 amplification cycles) was used as a loading control. Three biological and three technical replicates were performed.
Figure 10.
Figure 10.
Analysis of the Phosphorylation Status of MAP65-1 Using Phos-Tag. (A) Phos-Tag SDS-PAGE coupled to immunoblot detection using a MAP65-1–specific antibody. The black arrow indicates the phosphorylated form (top bands retarded in mobility), while the white arrow indicates the nonphosphorylated form (bottom bands). In both the anp2 anp3 and the mpk4 mutants, the relative amount of the phospho-MAP65-1 form was dramatically reduced compared with the total amount of the protein. Anti-actin staining was used as a loading control. (B) Probing the efficiency of Phos-Tag technology to discriminate phosphorylated from nonphosphorylated MAP65-1 in Col-0 extracts subjected or not to hyperosmotic stress (500 mM sorbitol, 30 min) in the absence or presence of the MAPKK inhibitor PD98059 (20 μM, 2 h pretreatment followed by 30 min with 500 mM sorbitol). The bottom band (white arrow) represents the nonphosphorylated form of MAP65-1. The top band (black arrow) represents the phosphorylated form of MAP65-1, which diminished during the PD98059 treatment and was completely eliminated following λ-phosphatase (λPPase) treatment of the extract prior to electrophoresis.
Figure 11.
Figure 11.
Putative Interactions between MPK4 and MAP65-1. (A) Endogenous MAP65-1 was immunoprecipitated, and the final pellet was immunoblotted with anti-MAP65-1 (lane 1) or anti-MPK4 (lane 2). Input (bottom row) detects MPK4 in 10% of the original extract. (B) Extracts (100 μg of total protein) were supplemented with 10 μM of recombinant 6×His-tagged MAP65-1 (lane 1) or with Ni-NTA agarose beads in the absence of 6×His-tagged MAP65-1 (lane 2). Input detects MPK4 in 10% of the original extract.

References

    1. Akhmanova A., Steinmetz M.O. (2008). Tracking the ends: A dynamic protein network controls the fate of microtubule tips. Nat. Rev. Mol. Cell Biol. 9: 309–322 - PubMed
    1. Bao Y., Kost B., Chua N.H. (2001). Reduced expression of alpha-tubulin genes in Arabidopsis thaliana specifically affects root growth and morphology, root hair development and root gravitropism. Plant J. 28: 145–157 - PubMed
    1. Baskin T.I., Wilson J.E., Cork A., Williamson R.E. (1994). Morphology and microtubule organization in Arabidopsis roots exposed to oryzalin or taxol. Plant Cell Physiol. 35: 935–942 - PubMed
    1. Bethke G., Unthan T., Uhrig J.F., Pöschl Y., Gust A.A., Scheel D., Lee J. (2009). Flg22 regulates the release of an ethylene response factor substrate from MAP kinase 6 in Arabidopsis thaliana via ethylene signaling. Proc. Natl. Acad. Sci. USA 106: 8067–8072 - PMC - PubMed
    1. Bibikova T.N., Blancaflor E.B., Gilroy S. (1999). Microtubules regulate tip growth and orientation in root hairs of Arabidopsis thaliana. Plant J. 17: 657–665 - PubMed

Publication types

MeSH terms

Substances