

Blood-brain barrier permeability for ammonia in patients with different grades of liver fibrosis is not different from healthy controls
- PMID: 20216550
- PMCID: PMC2949228
- DOI: 10.1038/jcbfm.2010.22
Blood-brain barrier permeability for ammonia in patients with different grades of liver fibrosis is not different from healthy controls
Abstract
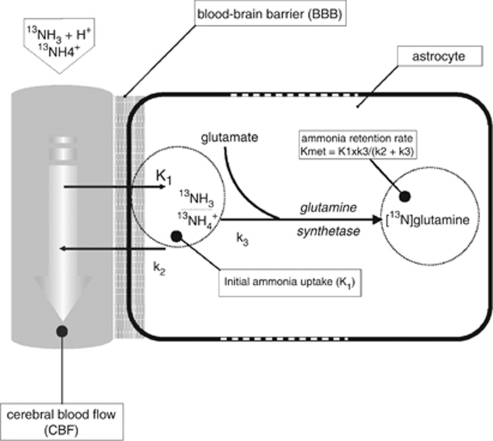
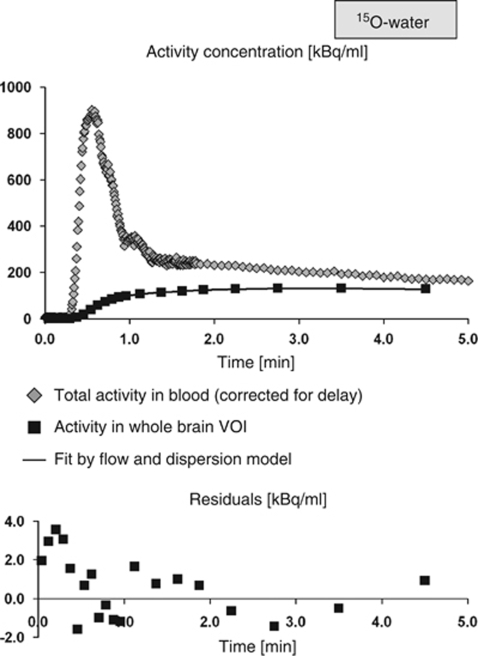
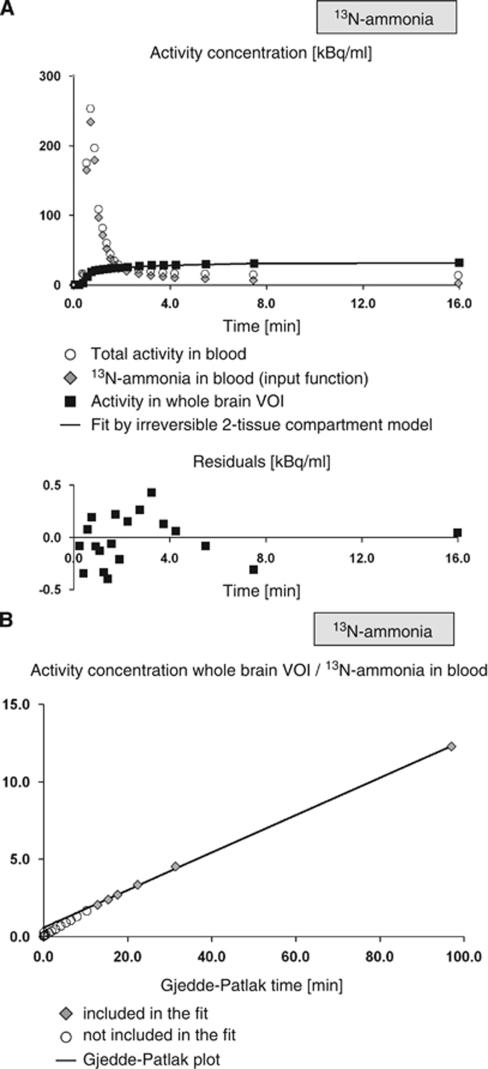
Increased blood-brain barrier (BBB) permeability for ammonia is considered to be an integral part of the pathophysiology of hepatic encephalopathy (HE) in patients with liver cirrhosis. Increased glutamate-/glutamine-signal intensity in magnetic resonance spectroscopic studies of the brain in cirrhotic patients was explained as a consequence of increased cerebral ammonia uptake. As similar spectroscopic alterations are present in patients with liver fibrosis, we hypothesized that BBB permeability for ammonia is already increased in liver fibrosis, and thereby contributing to the development of HE. To test this hypothesis, cerebral perfusion and ammonia metabolism were examined through positron emission tomography with (15)O-water, respectively, (13)N-ammonia in patients with Ishak grades 2 and 4 fibrosis, cirrhosis, and healthy controls. There were neither global nor regional differences of cerebral blood flow, the rate constant of unidirectional transport of ammonia from blood into brain tissue, the permeability surface area product of the BBB for ammonia, the net metabolic clearance rate constant of ammonia from blood into glutamine in brain, or the metabolic rate of ammonia. The hypothesis that increased permeability of the BBB for ammonia in patients with liver fibrosis contributes to the later development of HE could not be supported by this study.
Figures
References
-
- Ahl B, Weissenborn K, van den Hoff J, Fischer-Wasels D, Köstler H, Hecker H, Burchert W. Regional differences in cerebral blood flow and cerebral ammonia metabolism in patients with cirrhosis. Hepatology. 2004;40:73–79. - PubMed
-
- Andersson JLR, Vagnhammar BE, Schneider H. Accurate attenuation correction despite movement during PET imaging. J Nucl Med. 1995;36:670–678. - PubMed
-
- Berding G, Banati RB, Buchert R, Chierichetti F, Grover VPB, Kato A, Keiding S, Taylor-Robinson SD. Radiotracer imaging studies in hepatic encephalopathy: ISHEN practice guidelines. Liver Int. 2009;29:621–628. - PubMed
-
- Butterworth RF. Pathogenesis of hepatic encephalopathy: new insights from neuroimaging and molecular studies. J Hepatol. 2003;39:278–285. - PubMed
-
- Carroll TJ, Teneggi V, Jobin M, Squassante L, Treyer V, Hany TF, Burger C, Wang L, Bye A, von Schulthess GK, Buck A. Absolute quantification of cerebral blood flow with magnetic resonance, reproducibility of the method, and comparison with H2(15)O positron emission tomography. J Cereb Blood Flow Metab. 2002;22:1149–1156. - PubMed
MeSH terms
Substances
LinkOut - more resources
Full Text Sources
Medical
Research Materials
