Temperament in middle childhood: A behavioral genetic analysis of fathers' and mothers' reports
- PMID: 20216930
- PMCID: PMC2834313
- DOI: 10.1016/j.jrp.2009.04.008
Temperament in middle childhood: A behavioral genetic analysis of fathers' and mothers' reports
Abstract
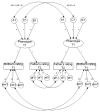
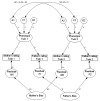
The genetic and environmental sources of variance in mothers' and fathers' ratings of child temperament in middle childhood were estimated and compared. Parents of 88 MZ twin pairs and 109 same-sex DZ twin pairs completed a temperament questionnaire. For Effortful Control, significant genetic and environmental effects were indicated across mothers' and fathers' ratings, but parent differences were found for the Negative Affectivity factor. When present, sibling contrast effects were not consistent for mothers and fathers. Parental ratings of the Effortful Control factor were best explained by the Biometric model whereas the Negative Affectivity factor was best explained by the Rater Bias model. Overall, mothers' and fathers' ratings yielded similar evidence of genetic and environmental etiology of temperament in middle childhood.
Figures


Similar articles
-
Understanding child-based effects on parenting: temperament as a moderator of genetic and environmental contributions to parenting.Dev Psychol. 2011 May;47(3):676-92. doi: 10.1037/a0021812. Dev Psychol. 2011. PMID: 21142365
-
Parental Relationship with Twins from Pregnancy to 3 Months: The Relation Among Parenting Stress, Infant Temperament, and Well-Being.Front Psychol. 2016 Oct 21;7:1628. doi: 10.3389/fpsyg.2016.01628. eCollection 2016. Front Psychol. 2016. PMID: 27818641 Free PMC article.
-
Comparison of mothers' and fathers' temperament ratings of referred and nonreferred preschool children.J Clin Psychol. 1983 Nov;39(6):1013-20. doi: 10.1002/1097-4679(198311)39:6<1013::aid-jclp2270390634>3.0.co;2-5. J Clin Psychol. 1983. PMID: 6662926
-
Associations between mothers' and fathers' depression and anxiety prior to birth and infant temperament trajectories over the first year of life: Evidence from diagnoses and symptom severity.J Affect Disord. 2023 Dec 15;343:31-41. doi: 10.1016/j.jad.2023.09.023. Epub 2023 Sep 21. J Affect Disord. 2023. PMID: 37741466 Free PMC article.
-
Parental agreement of reporting parent to child aggression using the Conflict Tactics Scales.Child Abuse Negl. 2012 Jun;36(6):510-8. doi: 10.1016/j.chiabu.2012.04.005. Epub 2012 Jul 2. Child Abuse Negl. 2012. PMID: 22763358 Free PMC article.
Cited by
-
Family matters: Intergenerational and interpersonal processes of executive function and attentive behavior.Curr Dir Psychol Sci. 2014 Jun 1;23(3):230-236. doi: 10.1177/0963721414531597. Curr Dir Psychol Sci. 2014. PMID: 25197171 Free PMC article.
-
Longitudinal Associations Across Prematurity, Attention, and Language in School-Age Children.J Speech Lang Hear Res. 2017 Dec 20;60(12):3601-3608. doi: 10.1044/2017_JSLHR-L-17-0015. J Speech Lang Hear Res. 2017. PMID: 29204607 Free PMC article.
-
Development of temperament types from infancy to adolescence: Genetic and environmental influences with an economically and racially/ethnically diverse sample.Dev Psychol. 2024 Nov;60(11):2200-2219. doi: 10.1037/dev0001828. Epub 2024 Aug 22. Dev Psychol. 2024. PMID: 39172413 Free PMC article.
-
Working memory and parent-rated components of attention in middle childhood: a behavioral genetic study.Behav Genet. 2012 Mar;42(2):199-208. doi: 10.1007/s10519-011-9508-8. Epub 2011 Sep 27. Behav Genet. 2012. PMID: 21948215 Free PMC article.
-
Intergenerational transmission of self-regulation: A multidisciplinary review and integrative conceptual framework.Psychol Bull. 2015 May;141(3):602-654. doi: 10.1037/a0038662. Psychol Bull. 2015. PMID: 25938878 Free PMC article. Review.
References
-
- Burnham KP, Anderson DR. Model selection and inference: A practical information-theoretic approach. Springer; New York: 1998.
-
- Buss A, Plomin R. Temperament: Early developing personality traits. Erlbaum; Hillsdale, NJ: 1984.
-
- Cherny SS, Fulker DW, Corley R, Plomin R, DeFries JC. Continuity and change in infant shyness from 14 to 20 months. Behavior Genetics. 1994;24:365–379. - PubMed
-
- Cyphers LH, Phillips K, Fulker DW, Mrazek DA. Twin temperament during the transition from infancy to early childhood. Journal of the American Academy of Child & Adolescent Psychiatry. 1990;29:392–397. - PubMed
-
- Field T, Greenberg R. Temperament ratings by parents and teachers of infants, toddles, and preschool children. Child Development. 1982;53:160–163.
Grants and funding
LinkOut - more resources
Full Text Sources
