

Human (13)N-ammonia PET studies: the importance of measuring (13)N-ammonia metabolites in blood
- PMID: 20217201
- PMCID: PMC2850514
- DOI: 10.1007/s11011-010-9181-2
Human (13)N-ammonia PET studies: the importance of measuring (13)N-ammonia metabolites in blood
Abstract
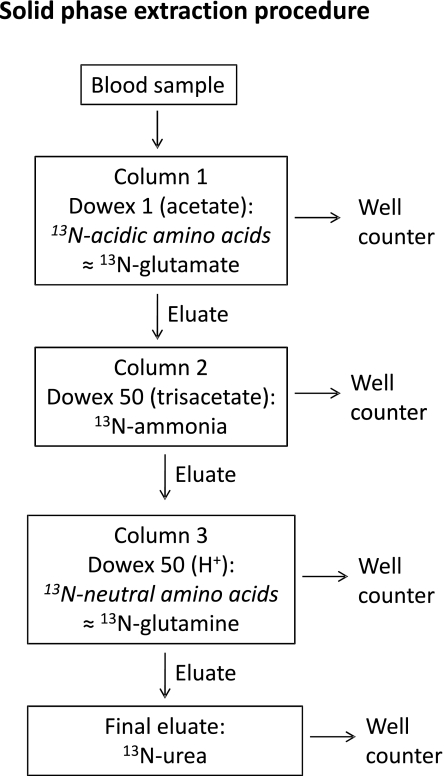
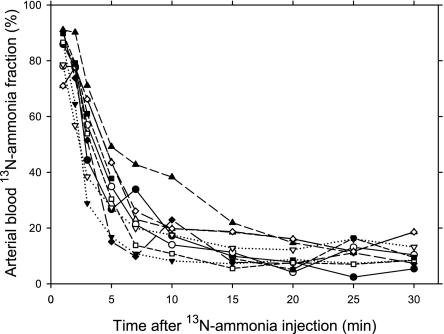
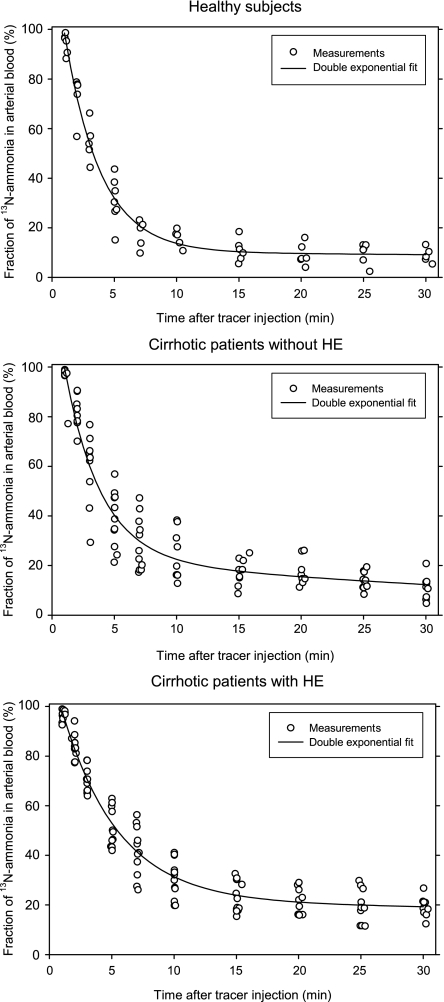
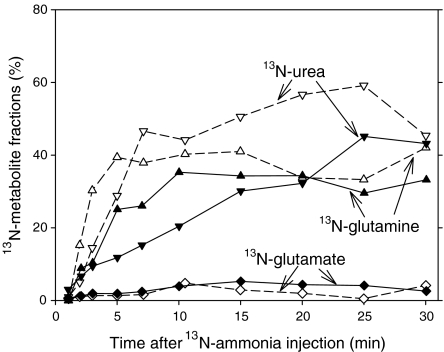
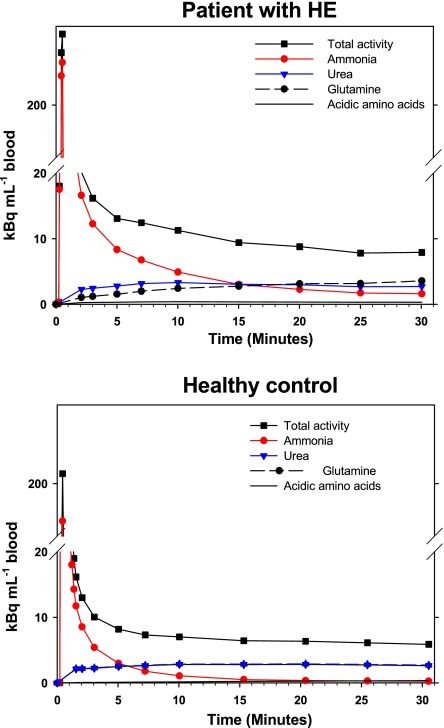
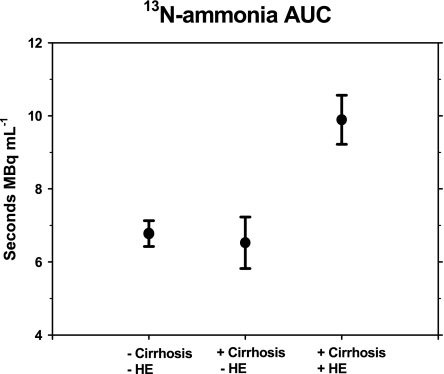
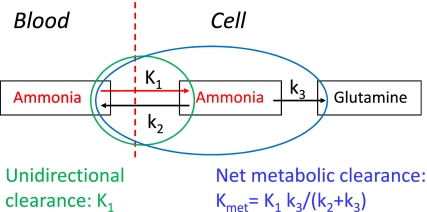
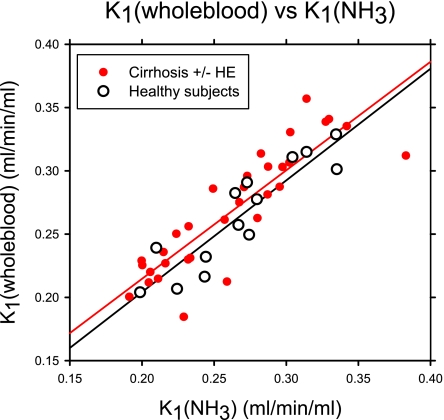
Dynamic (13)N-ammonia PET is used to assess ammonia metabolism in brain, liver and muscle based on kinetic modeling of metabolic pathways, using arterial blood (13)N-ammonia as input function. Rosenspire et al. (1990) introduced a solid phase extraction procedure for fractionation of (13)N-content in blood into (13)N-ammonia, (13)N-urea, (13)N-glutamine and (13)N-glutamate. Due to a radioactive half-life for (13)N of 10 min, the procedure is not suitable for blood samples taken beyond 5-7 min after tracer injection. By modifying Rosenspire's method, we established a method enabling analysis of up to 10 blood samples in the course of 30 min. The modified procedure was validated by HPLC and by 30-min reproducibility studies in humans examined by duplicate (13)N-ammonia injections with a 60-min interval. Blood data from a (13)N-ammonia brain PET study (from Keiding et al. 2006) showed: (1) time courses of (13)N-ammonia fractions could be described adequately by double exponential functions; (2) metabolic conversion of (13)N-ammonia to (13)N-metabolites were in the order: healthy subjects > cirrhotic patients without HE > cirrhotic patients with HE; (3) kinetics of initial tracer distribution in tissue can be assessed by using total (13)N-concentration in blood as input function, whereas assessment of metabolic processes requires (13)N-ammonia measurements.
Figures
Similar articles
-
Backflux of ammonia from brain to blood in human subjects with and without hepatic encephalopathy.Metab Brain Dis. 2009 Mar;24(1):237-42. doi: 10.1007/s11011-008-9126-1. Epub 2008 Dec 10. Metab Brain Dis. 2009. PMID: 19067140
-
New findings on cerebral ammonia uptake in HE using functional (13)N-ammonia PET.Metab Brain Dis. 2007 Dec;22(3-4):277-84. doi: 10.1007/s11011-007-9066-1. Metab Brain Dis. 2007. PMID: 17828586 Review.
-
Brain metabolism of 13N-ammonia during acute hepatic encephalopathy in cirrhosis measured by positron emission tomography.Hepatology. 2006 Jan;43(1):42-50. doi: 10.1002/hep.21001. Hepatology. 2006. PMID: 16374868
-
13N as a tracer for studying glutamate metabolism.Neurochem Int. 2011 Sep;59(4):456-64. doi: 10.1016/j.neuint.2010.11.011. Epub 2010 Nov 23. Neurochem Int. 2011. PMID: 21108979 Free PMC article. Review.
-
Brain metabolism in patients with hepatic encephalopathy studied by PET and MR.Arch Biochem Biophys. 2013 Aug 15;536(2):131-42. doi: 10.1016/j.abb.2013.05.006. Epub 2013 May 30. Arch Biochem Biophys. 2013. PMID: 23726863 Review.
Cited by
-
Effect of glutamine synthetase inhibition on brain and interorgan ammonia metabolism in bile duct ligated rats.J Cereb Blood Flow Metab. 2014 Mar;34(3):460-6. doi: 10.1038/jcbfm.2013.218. Epub 2013 Dec 18. J Cereb Blood Flow Metab. 2014. PMID: 24346692 Free PMC article.
-
Astrocyte glutamine synthetase: importance in hyperammonemic syndromes and potential target for therapy.Neurotherapeutics. 2010 Oct;7(4):452-70. doi: 10.1016/j.nurt.2010.05.015. Neurotherapeutics. 2010. PMID: 20880508 Free PMC article. Review.
-
Cerebral effects of ammonia in liver disease: current hypotheses.Metab Brain Dis. 2014 Dec;29(4):901-11. doi: 10.1007/s11011-014-9494-7. Epub 2014 Feb 4. Metab Brain Dis. 2014. PMID: 24488230 Review.
-
Pathogenesis of hepatic encephalopathy: role of ammonia and systemic inflammation.J Clin Exp Hepatol. 2015 Mar;5(Suppl 1):S7-S20. doi: 10.1016/j.jceh.2014.06.004. Epub 2014 Jun 30. J Clin Exp Hepatol. 2015. PMID: 26041962 Free PMC article. Review.
-
Clinical Quantification of Myocardial Blood Flow Using PET: Joint Position Paper of the SNMMI Cardiovascular Council and the ASNC.J Nucl Cardiol. 2018 Feb;25(1):269-297. doi: 10.1007/s12350-017-1110-x. J Nucl Cardiol. 2018. PMID: 29243073 No abstract available.
References
-
- Berl S, Takagaki G, Clarke DD, Waelsch H. Metabolic compartments in vivo. Ammonia and glutamic acid metabolism in brain and liver. J Biol Chem. 1962;237:2562–2569. - PubMed
Publication types
MeSH terms
Substances
Grants and funding
LinkOut - more resources
Full Text Sources
