

Electrical bursting, calcium oscillations, and synchronization of pancreatic islets
- PMID: 20217502
- PMCID: PMC3120131
- DOI: 10.1007/978-90-481-3271-3_12
Electrical bursting, calcium oscillations, and synchronization of pancreatic islets
Abstract
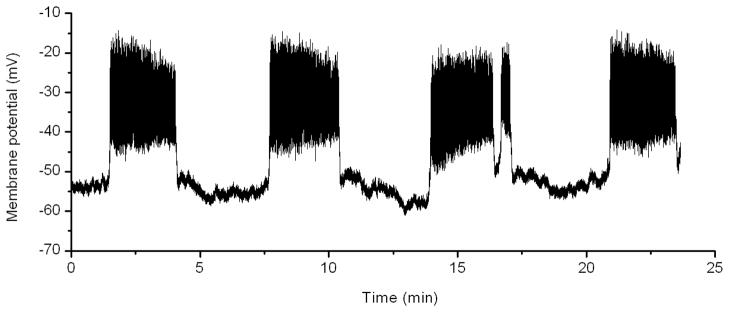
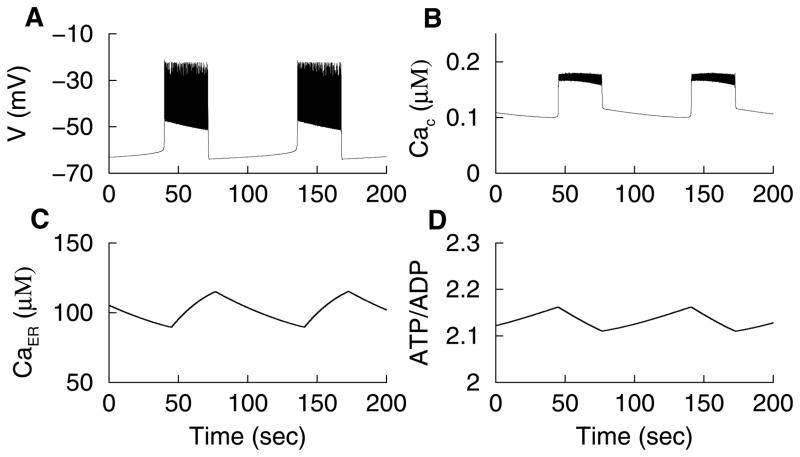
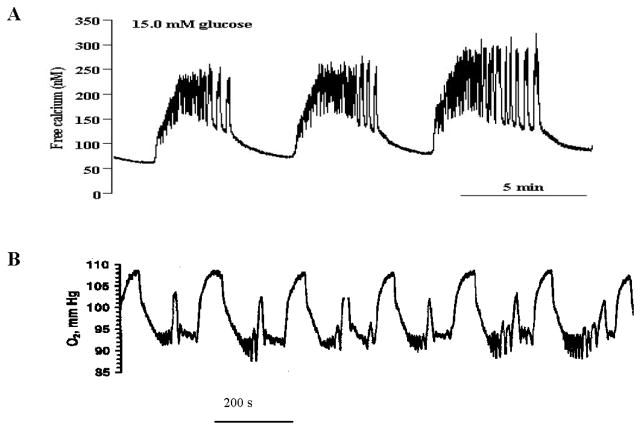
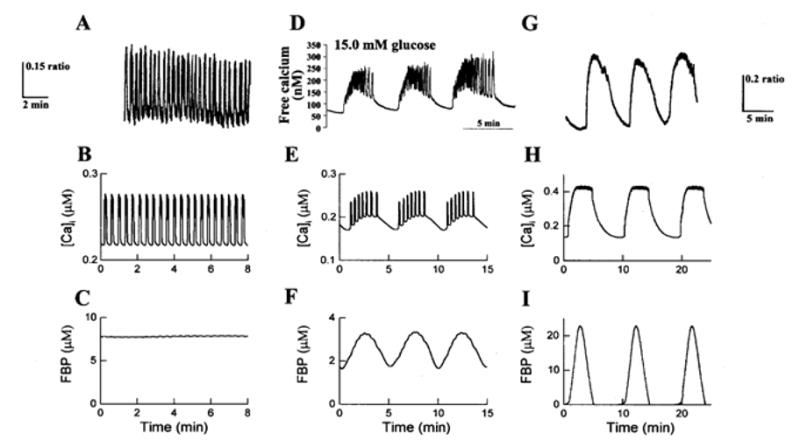
Oscillations are an integral part of insulin secretion and are ultimately due to oscillations in the electrical activity of pancreatic beta-cells, called bursting. In this chapter we discuss islet bursting oscillations and a unified biophysical model for this multi-scale behavior. We describe how electrical bursting is related to oscillations in the intracellular Ca(2+) concentration within beta-cells and the role played by metabolic oscillations. Finally, we discuss two potential mechanisms for the synchronization of islets within the pancreas. Some degree of synchronization must occur, since distinct oscillations in insulin levels have been observed in hepatic portal blood and in peripheral blood sampling of rats, dogs, and humans. Our central hypothesis, supported by several lines of evidence, is that insulin oscillations are crucial to normal glucose homeostasis. Disturbance of oscillations, either at the level of the individual islet or at the level of islet synchronization, is detrimental and can play a major role in type 2 diabetes.
Figures
Similar articles
-
Long lasting synchronization of calcium oscillations by cholinergic stimulation in isolated pancreatic islets.Biophys J. 2008 Nov 15;95(10):4676-88. doi: 10.1529/biophysj.107.125088. Epub 2008 Aug 15. Biophys J. 2008. PMID: 18708464 Free PMC article.
-
Intra- and inter-islet synchronization of metabolically driven insulin secretion.Biophys J. 2005 Jul;89(1):107-19. doi: 10.1529/biophysj.104.055681. Epub 2005 Apr 15. Biophys J. 2005. PMID: 15834002 Free PMC article.
-
Intact pancreatic islets and dispersed beta-cells both generate intracellular calcium oscillations but differ in their responsiveness to glucose.Cell Calcium. 2019 Nov;83:102081. doi: 10.1016/j.ceca.2019.102081. Epub 2019 Sep 16. Cell Calcium. 2019. PMID: 31563790 Free PMC article.
-
Cytosolic calcium oscillations and insulin release in pancreatic islets of Langerhans.Diabetes Metab. 1998 Feb;24(1):37-40. Diabetes Metab. 1998. PMID: 9534007 Review.
-
Metabolic and electrical oscillations: partners in controlling pulsatile insulin secretion.Am J Physiol Endocrinol Metab. 2007 Oct;293(4):E890-900. doi: 10.1152/ajpendo.00359.2007. Epub 2007 Jul 31. Am J Physiol Endocrinol Metab. 2007. PMID: 17666486 Review.
Cited by
-
LRRC8/VRAC anion channels enhance β-cell glucose sensing and insulin secretion.Nat Commun. 2018 May 17;9(1):1974. doi: 10.1038/s41467-018-04353-y. Nat Commun. 2018. PMID: 29773801 Free PMC article.
-
Metabolic synchronization by traveling waves in yeast cell layers.Biophys J. 2011 Feb 16;100(4):809-13. doi: 10.1016/j.bpj.2010.12.3704. Biophys J. 2011. PMID: 21320423 Free PMC article.
-
Learning theories reveal loss of pancreatic electrical connectivity in diabetes as an adaptive response.PLoS One. 2013 Aug 1;8(8):e70366. doi: 10.1371/journal.pone.0070366. Print 2013. PLoS One. 2013. PMID: 23936417 Free PMC article.
-
ER stress increases store-operated Ca2+ entry (SOCE) and augments basal insulin secretion in pancreatic beta cells.J Biol Chem. 2020 Apr 24;295(17):5685-5700. doi: 10.1074/jbc.RA120.012721. Epub 2020 Mar 16. J Biol Chem. 2020. PMID: 32179650 Free PMC article.
-
Type 2 Diabetes-Associated K+ Channel TALK-1 Modulates β-Cell Electrical Excitability, Second-Phase Insulin Secretion, and Glucose Homeostasis.Diabetes. 2015 Nov;64(11):3818-28. doi: 10.2337/db15-0280. Epub 2015 Aug 3. Diabetes. 2015. PMID: 26239056 Free PMC article.
References
-
- Santos RM, Rosario LM, Nadal A, Garcia-Sancho J, Soria B, Valdeolmillos M. Widespread synchronous [Ca2+]i oscillations due to bursting electrical activity in single pancreatic islets. Pflügers Archiv. 1991;418:417–422. - PubMed
-
- Beauvois MC, Merezak C, Jonas J-C, Ravier MA, Henquin J-C. Glucose-induced mixed [Ca2+]c oscillations in mouse β–cells are controlled by the membrane potential and the SERCA3 Ca2+-ATPase of the endoplasmic reticulum. Am J Physiol. 2006;290:C1503–C1511. - PubMed
-
- Gilon P, Shepherd RM, Henquin JC. Oscillations of secretion driven by oscillations of cytoplasmic Ca2+ as evidenced in single pancreatic islets. J Biol Chem. 1993;268:22265–22268. - PubMed
-
- Pørksen N. The in vivo regulation of pulsatile insulin secretion. Diabetologia. 2002;45:3–20. - PubMed
-
- Nunemaker CS, Zhang M, Wasserman DH, McGuinness OP, Powers AC, Bertram R, Sherman A, Satin LS. Individual mice can be distinguished by the period of their islet calcium oscillations: Is there an intrinsic islet period that is imprinted in vivo? Diabetes. 2005;54:3517–3522. - PubMed
Publication types
MeSH terms
Substances
Grants and funding
LinkOut - more resources
Full Text Sources
Other Literature Sources
Miscellaneous
