

doi: 10.1007/978-1-60761-670-2_4.
High-affinity immobilization of proteins using biotin- and GST-based coupling strategies
Affiliations
- PMID: 20217614
- PMCID: PMC3025018
- DOI: 10.1007/978-1-60761-670-2_4
Item in Clipboard
High-affinity immobilization of proteins using biotin- and GST-based coupling strategies
Methods Mol Biol.
2010.
Abstract
Surface plasmon resonance (SPR) is a highly sensitive method for the detection of molecular interactions. One interacting partner is immobilized on the sensor chip surface while the other is injected across the sensor surface. This chapter focuses on high-affinity immobilization of protein substrates for affinity and kinetic analyses using biotin/streptavidin interaction and GST/anti-GST-antibody interaction.
Figures
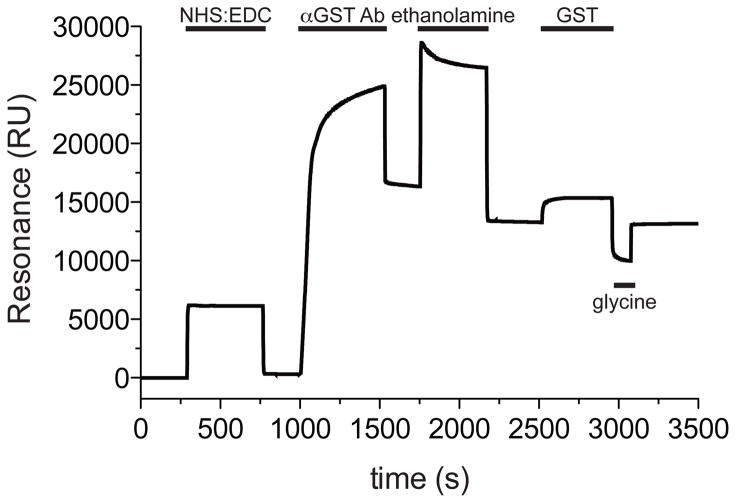
The flow cell surface was activated for direct amine coupling of the anti-GST antibody (αGST-Ab) by injecting the coupling solution (40 μl NHS/EDC at 5 μl/min flow rate with EXTRACLEAN command). Anti-GST antibody was then diluted to 30 μg/ml in immobilization buffer and 45 μl were injected at 5 μl/min flow rate, omitting the EXTRACLEAN command. To deactivate esters on the sensor chip surface, ethanolamine was injected (35 μl at 5 μl/min flow rate with EXTRACLEAN command). To test the binding surface, supplied recombinant GST protein was diluted to 5 μg/ml and 100 μl were injected over the sensor chip at 20 μl/min flow rate. To remove GST from the binding surface, 40 μl of glycine-HCl pH 2.2 was injected at 20 μl/min flow rate.
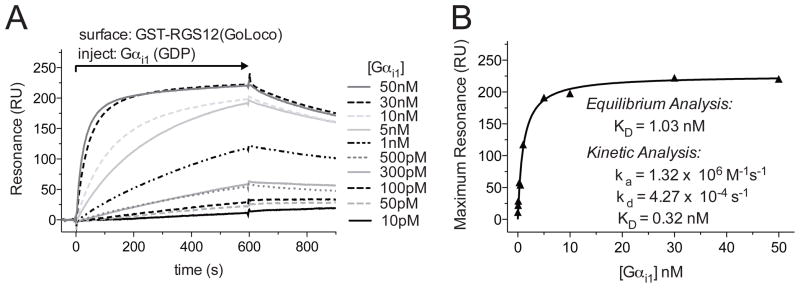
A. Flow cells 1 and 2 were loaded with 1000 RUs of GST and GST-RGS12GoLoco proteins, respectively. Increasing concentrations of Gαi1 were injected using the KINJECT command (300 μl injections with a 200 second dissociation phase at 20 μl/min flow rate). Specific binding was determined by subtracting non-specific binding to a GST control flow cell from the GST-RGS12GoLoco response curve. B. Binding affinities were determined by plotting the maximum response attained at each concentration of Gαi1 versus the concentration of the Gαi1, then by fitting to a Langmuir binding isotherm using GraphPad Prism 5.0 (GraphPad Software, La Jolla, CA) to determine dissociation constant (KD). Kinetic analyses of the association (ka) and dissociation (kd) rates were also used to determine KD using the simultaneous ka/kd (1:1 Langmuir) model (BIAevaluation). Differences in KD determinations between kinetic and equilibrium analyses are likely to reflect mass-transport and/or rebinding limitations to binding assay execution, as indicated by large ka values, nearly linear initial association seen on sensorgrams, and/or greatly slowed dissociation (see Schuck, P. et al. in this Volume for further information).
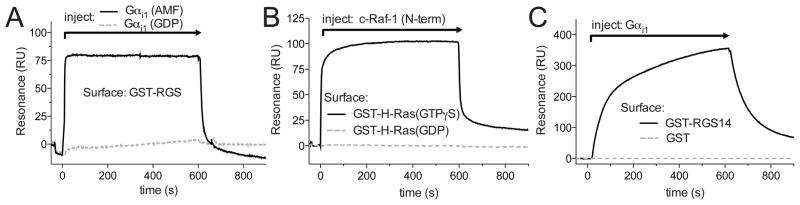
A. A GST-RGS fusion protein was immobilized on the surface of flow cell 1 and GST was immobilized on the surface of flow cell 2 (the latter surface to use to subtract sensorgram changes in resonance due to buffer shifts). Gαi1 pre-incubated with either GDP or GDP+Mg2++AlF4− (AMF), a transition-state mimetic form known to bind avidly to RGS proteins, was injected over the sensor surface. GST-RGS bound to the Gαi1(AMF) but not Gαi1(GDP) as expected. B. GST-H-Ras loaded with a non-hydrolyzable GTP analogue, GTPγS, was loaded in flow cell 1, GST-H-Ras loaded with GDP was loaded in flow cell 2, and GST control was loaded in flow cell 3. An N-terminal construct of c-Raf-1, a known H-Ras binding partner, was injected across the sensor chip surface. The data show the nucleotide state selectivity of the H-Ras/c-Raf-1 interaction. C. GST-RGS14 was loaded in flow cell 1 and GST was loaded in flow cell 2. Gαi1 was injected in GDP+Mg2++AlF4− (AMF) Running Buffer over the sensor chip surface and a Gαi1/RGS14 specific interaction was detected. Specific binding for all injections was determined by subtracting the non-specific binding observed from a GST control flow cell from the experiment-containing flow cells.
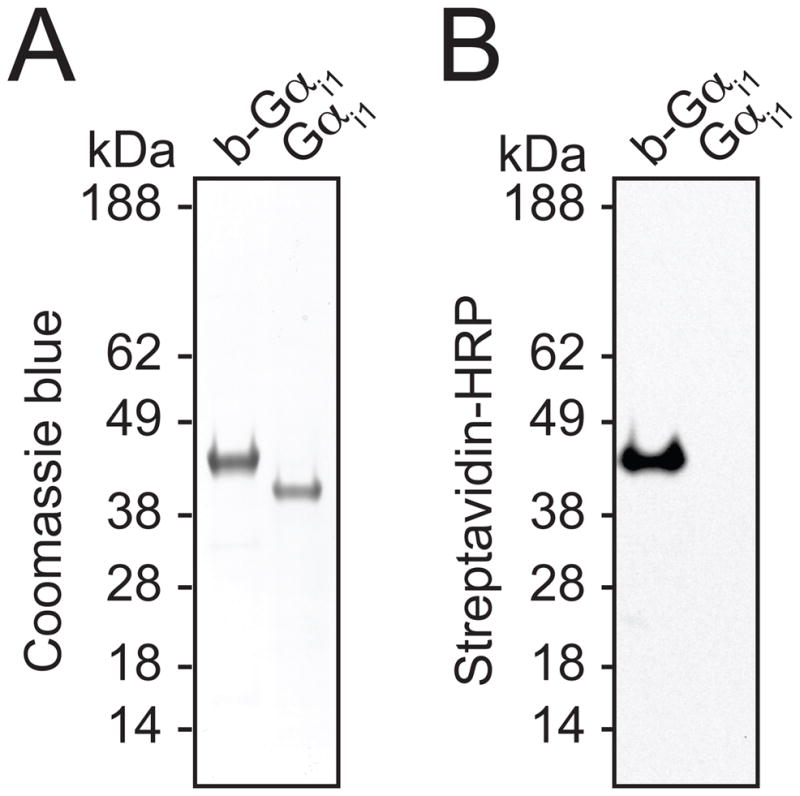
A. SDS-PAGE gel stained with Coomassie Blue dye reveals the migration of biotinylated Gαi1, designated b-Gαi1, and unlabeled Gαi1. B. Immunoblot of SDS-PAGE gel transferred to nitrocellulose using streptavidin-horseradish peroxidase antibody to detect biotinylated protein.
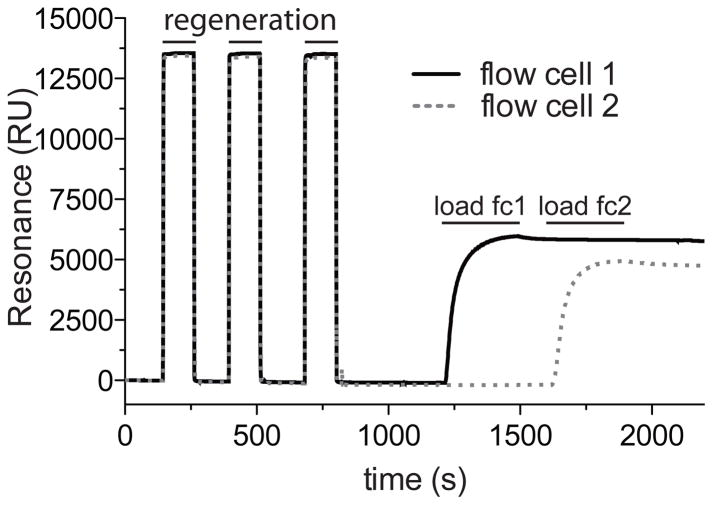
A typical sensorgram generated during the loading of biotinylated protein to flow cells 1 and 2. The flow cell surface was stabilized with 3 × 20 μl injections of Regeneration Buffer before loading of biotinylated-Gαi1 (260 nM final concentration, as diluted in Biotin-conjugate Immobilization Buffer), one flow cell at a time, until saturation is observed (note plateau in sensorgram curves).
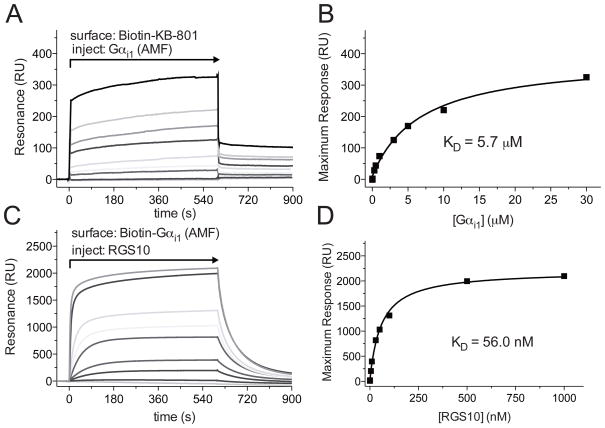
A. Flow cell 1 was loaded with 450 RUs of Biotin-KB-801 peptide, and flow cell 2 was loaded with 350 RUs mNotch peptide as a control. Increasing concentrations of Gαi1 in GDP+Mg2++AlF4− (AMF) Buffer, the transition state mimetic form, were injected over the sensor surface as indicated, using the KINJECT command (300 μl injections with a 200 second dissociation phase at 20 μl/min flow rate). Binding curves were obtained by subtracting non-specific binding to a non-interacting biotinylated peptide from all experiment-containing flow cells. B. Binding affinities were determined by plotting the maximum response attained at each concentration of Gαi1 versus the concentration of the Gαi1, then by fitting to a rectangular hyperbola to determine KD using GraphPad Prism 5.0 (Graphpad Software, La Jolla, CA). C. Flow cell 1 was loaded with 450 RUs of Biotin-Gαi1, and flow cell 2 was loaded with an equivalent RU signal of denatured Biotin-Gαi1. Varying concentrations of RGS10 in GDP+Mg2++AlF4− (AMF) Buffer were injected over the sensor surface as indicated, using the KINJECT command (300 μl injections with a 200 second dissociation phase at 20 μl/min flow rate). Specific binding was determined by subtracting non-specific binding from a flow cell containing denatured biotin-Gαi1. D. Binding affinities were determined by plotting the maximum response attained at each concentration of RGS10 versus the concentration of the RGS10, then by fitting to a rectangular hyperbola to determine KD using GraphPad Prism 5.0 (GraphPad Software, La Jolla, CA). These final panels were reproduced from Soundararajan et al. 2008 (ref. (7)). Copyright (c) 2008 National Academy of Sciences, U.S.A.
Similar articles
-
Comparison of single domain antibody immobilization strategies evaluated by surface plasmon resonance.J Immunol Methods. 2013 Feb 28;388(1-2):68-77. doi: 10.1016/j.jim.2012.11.014. Epub 2012 Dec 20. J Immunol Methods. 2013. PMID: 23261918
-
A capture coupling method for the covalent immobilization of hexahistidine tagged proteins for surface plasmon resonance.Methods Mol Biol. 2010;627:91-100. doi: 10.1007/978-1-60761-670-2_5. Methods Mol Biol. 2010. PMID: 20217615 Free PMC article.
-
Protein-Ligand Interactions Using SPR Systems.Methods Mol Biol. 2013;1008:139-65. doi: 10.1007/978-1-62703-398-5_6. Methods Mol Biol. 2013. PMID: 23729252
-
A simple and robust approach to immobilization of antibody fragments.J Immunol Methods. 2016 Aug;435:7-16. doi: 10.1016/j.jim.2016.04.012. Epub 2016 Apr 30. J Immunol Methods. 2016. PMID: 27142477
-
Oriented Surface Immobilization of Antibodies Using Enzyme-Mediated Site-Specific Biotinylation for Enhanced Antigen-Binding Capacity.Langmuir. 2025 Apr 29;41(16):10576-10585. doi: 10.1021/acs.langmuir.5c00656. Epub 2025 Apr 20. Langmuir. 2025. PMID: 40253628 Free PMC article.
Cited by
-
Automated Solid-Phase Protein Modification with Integrated Enzymatic Digest for Reaction Validation: Application of a Compartmented Microfluidic Reactor for Rapid Optimization and Analysis of Protein Biotinylation.Front Bioeng Biotechnol. 2017 Nov 13;5:72. doi: 10.3389/fbioe.2017.00072. eCollection 2017. Front Bioeng Biotechnol. 2017. PMID: 29181376 Free PMC article.
-
Numerical analysis of hafnium oxide and phase change material-based multi-layered infrared and visible frequency sensor for biomolecules sensing application.Sci Rep. 2023 May 11;13(1):7698. doi: 10.1038/s41598-023-34817-1. Sci Rep. 2023. PMID: 37169783 Free PMC article.
-
An open-source drug discovery platform enables ultra-large virtual screens.Nature. 2020 Apr;580(7805):663-668. doi: 10.1038/s41586-020-2117-z. Epub 2020 Mar 9. Nature. 2020. PMID: 32152607 Free PMC article.
-
Tunable infrared metamaterial-based biosensor for detection of hemoglobin and urine using phase change material.Sci Rep. 2021 Mar 29;11(1):7101. doi: 10.1038/s41598-021-86700-6. Sci Rep. 2021. PMID: 33782516 Free PMC article.
-
Structural determinants of RGS-RhoGEF signaling critical to Entamoeba histolytica pathogenesis.Structure. 2013 Jan 8;21(1):65-75. doi: 10.1016/j.str.2012.11.012. Epub 2012 Dec 20. Structure. 2013. PMID: 23260656 Free PMC article.
References
-
- Malmqvist M, Karlsson R. Biomolecular interaction analysis: affinity biosensor technologies for functional analysis of proteins. Curr Opin Chem Biol. 1997;1:378–383. - PubMed
-
- Jason-Moller L, Murphy M, Bruno J. Curr Protoc Protein Sci. Unit 19. Chapter 19. 2006. Overview of Biacore systems and their applications; p. 13. - PubMed
-
- Majka J, Speck C. Analysis of protein-DNA interactions using surface plasmon resonance. Adv Biochem Eng Biotechnol. 2007;104:13–36. - PubMed
MeSH terms
Substances
Grants and funding
LinkOut - more resources
Full Text Sources
Other Literature Sources
Research Materials
