

doi: 10.1002/adma.200902380.
Biomimetic underwater adhesives with environmentally triggered setting mechanisms
Affiliations
- PMID: 20217779
- PMCID: PMC2855194
- DOI: 10.1002/adma.200902380
Item in Clipboard
Biomimetic underwater adhesives with environmentally triggered setting mechanisms
Adv Mater.
.
No abstract available
Figures
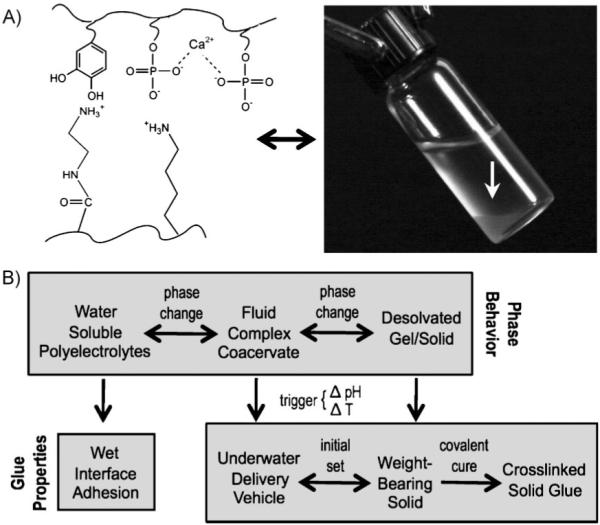
Complex coacervates as adhesives. A) The adhesive comprises dopamide containing poly-phosphate, poly-aminated gelatin, and divalent cations. Under the right conditions, the polyelectrolyte solution condenses into a complex coacervate phase (white arrow in photo). B) The top row represents the phase behavior of the polyelectrolytes. The bottom row connects the features of the phase behavior to solving the several problems of creating an underwater glue. The change from fluid complex coacervate to insoluble solid—the intial setting reation—is triggered by a change in the pH, temperature, or both. Irreversible covalent hardening occurs through oxidative coupling between catechol and primary amine sidechains.
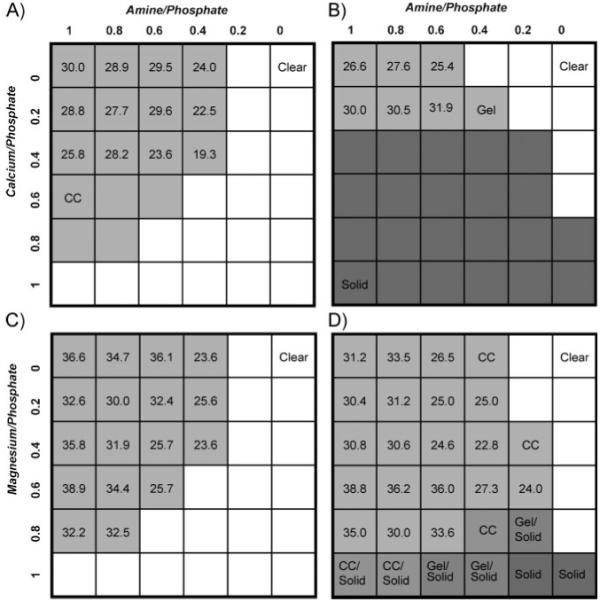
Phase diagrams of polyphosphate–gelatin–divalent cation mixtures. The top axis represents the molar ratio of amine sidechain to phosphate sidechain. The left axis represents the molar ratio of divalent cation to phosphate sidechain. A) Ca2+ compositions, pH 5.0. B) Ca2+ compositions, pH 7.4. C) Mg2+ compositions, pH 5.0. D) Mg2+ compositions, pH 7.4. The total concentration of copolymers in each mixture was 5.0 wt%. Soluble compositions are represented by white squares, compositions that condensed into complex coacervates are represented by light grey squares, compositions that formed gels or hard solid precipitates are represented by darker grey squares. The numbers in the light grey squares are the concentrations (wt/vol %) of the complex coacervate phase. Grey squares without numbers contained complex coacervates, but with volumes too low to allow accurate measurement of the concentration. The Mg2+ solid phases were softer and more gel-like than the Ca2+ solids.
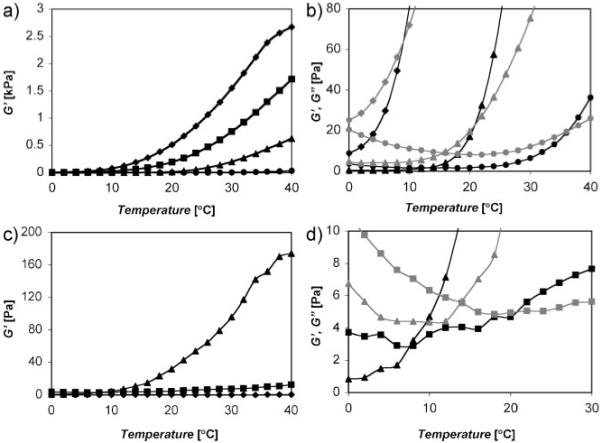
Transition temperatures determined by dynamic oscillatory rheology. a) Ca2+/gelatin/polyphosphate rheology. The elastic modulus (G’, black symbol) increased sigmoidally as the temperature was raised from 0 to 40 °C at Ca2+ ratios greater than 0.15. b) Expanded scale to demonstrate the crossover temperature of the elastic (G’) and viscous (G”, grey symbol) moduli. The solidification or gellation temperature decreased with increasing Ca2+ ratio. The 0.25 Ca2+ ratio was excluded for clarity. (Symbols: ◆ 0.3/0.6, ■ 0.25/0.6, ▲ 0.2/0.6, ●0.15/0.6 Ca2+ ratios). c) Mg2+/gelatin/polyphosphate rheology. (Symbols: ◆ 0.8/01.0, ■ 0.9/1.0, ▲ 1.0/01.0 Mg2+ ratios). d) Expanded scale to demonstrate the crossover temperature of the elastic (G’) and viscous (G”, grey symbol) moduli. The comparative measurements were made with constant strain of 0.1% and frequency of 1.0 Hz.
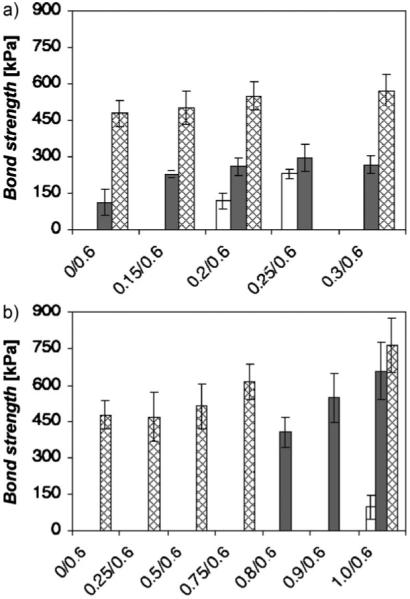
Shear strength as a function of divalent cation ratio and temperature. a) The ratio of Ca2+ to phosphate was varied at a constant amine ratio. b) The Mg2+ ratio was varied at a constant amine ratio. Standardized mechanical tests were done with clean aluminum adherends fully submerged in a temperature-controlled water bath (pH 7.4). Dark bars represent shear tests done at 37 °C without oxidative crosslinking. White bars indicate shear tests done below the transition temperature without oxidative crosslinking. Cross-hatched bars represent shear tests done at 37 °C after oxidative crosslinking with NaIO4 at a molar ratio of 1:2 relative to dopamide sidechains. The crosslinked specimens were cured (24 h) and tested while fully submerged in a temperature-controlled water bath. The bars represent the average +/− standard deviations (s.d.; n = 9 for all compositions and conditions).
References
-
- Jensen RA, Morse DE. J. Comp. Physiol. B. 1988;158:317.
-
- Waite JH, Jensen RA, Morse DE. Biochemistry. 1992;31:5733. - PubMed
-
- Stewart RJ, Weaver JC, Morse DE, Waite JH. J. Exp. Biol. 2004;207:4727. - PubMed
-
- Baier RE, Shafrin EG, Zisman WA. Science. 1968;162:1360. - PubMed
-
- Waite JH, Andersen NH, Jewhurst S, Sun C. J. Adhes. 2005;81:297.
Publication types
MeSH terms
Substances
Grants and funding
LinkOut - more resources
Full Text Sources
Other Literature Sources
