

doi: 10.1002/adma.200902895.
Cooperative nanoparticles for tumor detection and photothermally triggered drug delivery
Affiliations
- PMID: 20217810
- PMCID: PMC3057607
- DOI: 10.1002/adma.200902895
Item in Clipboard
Cooperative nanoparticles for tumor detection and photothermally triggered drug delivery
Adv Mater.
.
No abstract available
Figures
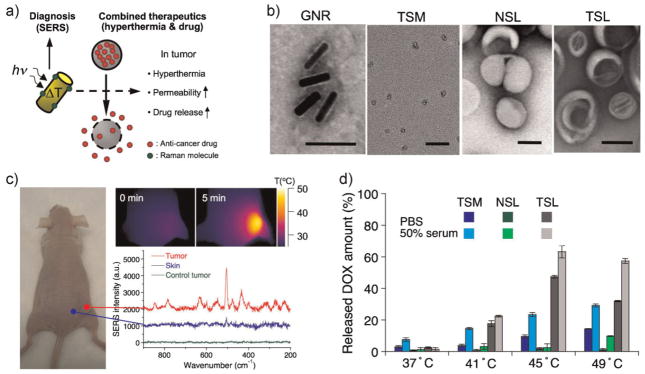
Characterization of the two components of a cooperative nanosystem. a) Schematic diagram depicting the cooperative nanomaterials system. b) TEM images of PEG-coated GNR, TSM, NSL, and TSL. The scale bars are all 100 nm. c) Optical image, thermal images, and Raman spectra of a mouse depicting the multifunctionality of the GNRs. The GNRs act as thermal transducers or as SERS contrast agents when irradiated with a laser of the appropriate wavelength and intensity. The mouse, bearing a MDA-MB-435 tumor, was injected intravenously with GNRs (10 mg Au kg−1). The IR thermographic maps shown were obtained 24 h post-injection; the left image was acquired immediately before and the right image 5 min after onset of irradiation with a diode laser (λ = 810 nm, 0.75 W cm−2). Raman spectra (5 acquisitions of 60 s each) were acquired from the tumoral region (red trace) and from skin near the tumor (blue trace). The GNRs in this experiment were labeled with a cyanine dye and the peaks in the trace correspond to the SERS spectrum cyanine dye (verified by in vitro control). d) Amount of DOX released in vitro from the liposome and micelle formulations used in this study, as a function of temperature. The samples were incubated for 10 min at the indicated temperatures and the amount of free DOX was quantified by fluorescence spectroscopy, relative to a standard curve. Values represent the mean and the error bars indicate standard deviation.
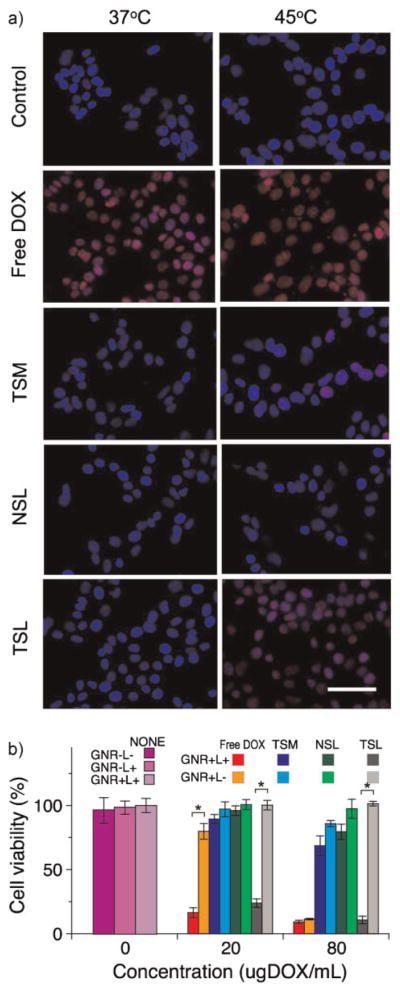
Temperature-induced intracellular drug delivery and cytotoxicity of the cooperative nanosystem. a) Images showing the intracellular delivery of DOX (red) from various therapeutic nanoparticle formulations to MDA-MB-435 human melanoma cells, at two different temperatures. The cells were incubated with free DOX, TSM, NSL, and TSL for 15 min at the indicated temperatures in a cell incubator. All formulations contain 80 μg mL−1 of DOX. Samples were rinsed three times with cell medium, then incubated for an additional 1 h at 37 °C and imaged. The nuclei were stained with 4′-6-diamidino-2-phenylindole (DAPI, blue). The scale bar indicates 100 μm. b) Cytotoxicity of various photothermally activated therapeutic nanoparticle formulations to MDA-MB-435 human melanoma cells, quantified by MTT assay (*P <0.05). The cells were incubated with free DOX, TSMs, NSLs, and TSLs at the indicated concentrations. GNR+ and GNR− indicate the presence or absence of GNRs (7 μg Au mL−1) in the mixture, respectively. L+ and L− indicate the presence or absence of NIR irradiation (810 nm, 0.75 W cm−2 for 15 min), respectively. After irradiation (or 15 min in the dark for L− samples), the cells were rinsed three times with the cell-culture medium and incubated for an additional 48 h at 37 °C before administration of the MTT assay. Values represent the mean and the error bars indicate standard deviation.
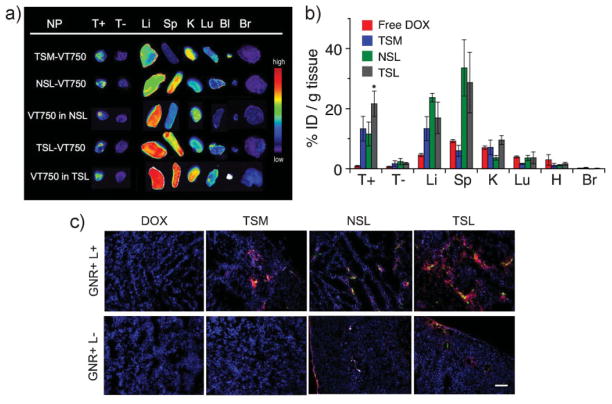
Fate of thermally responsive nanostructures in vivo. a) Fluorescence images of organs from mice, where one tumor was heated at 45 °C for 30 min immediately after injection of various VT750-labeled nanoparticle formulations. The NIR-fluorescent molecular probes VT750 (750 nm excitation, 780 nm emission) were either attached to the nanoparticle surface (TSM-VT750, NSL-VT750, and TSL-VT750) or encapsulated in the internal space of nanoparticles (VT750@NSL and VT750@TSL). Mice bearing bilateral MDA-MB-435 tumors were intravenously injected with various VT750-labeled nanoparticle formulations and one tumor was immediately heated at 45 °C for 30 min in a temperature-controlled water bath. At 2 h post-injection, the tissues were collected from the mice and imaged with a NIR fluorescence imaging system. b) Biodistribution of DOX for various therapeutic nanoparticle formulations after GNR-mediated photothermal heating. Mice bearing bilateral MDA-MB-435 tumors were injected with GNRs (10 mg Au kg−1). At 72 h post-injection, the indicated free DOX or therapeutic nanoparticle formulation was administered and one tumor was immediately irradiated (810 nm, ~0.75 W cm−2) for 30 min while maintaining an average tumor surface temperature of ~45 °C under IR thermographic surveillance. 24 h post-injection of the therapeutic nanoparticles, the tissues were collected from the mice and the native fluorescence intensity from DOX was quantified as a percentage of injected dose per tissue mass. Values represent the mean and the error bars indicate standard deviation. The differences in DOX concentration released from TSL in the heated tumor, relative to the other formulations (TSM and NSL), are significant (*P <0.05). c) Histological analysis of DOX distribution in MDA-MB-435 tumors treated with free DOX or the indicated therapeutic nanoparticle formulations and then subjected to GNR-mediated photothermal heating. The tissues were collected for hisotological analysis 6 h post-injection of the therapeutic nanoparticles (red: DOX, blue: DAPI nuclear stain, green: Alexa Fluor 488 labeled on the therapeutic nanoparticles). Abbreviations: NP, nanoparticle; T+, tumor heated to 45 °C; T−, tumor maintained at ambient temperature; Li, liver; Sp, spleen; K, kidney; Lu, lung; Bl, blood; Br, brain; H, heart. The scale bar indicates 200 μm.
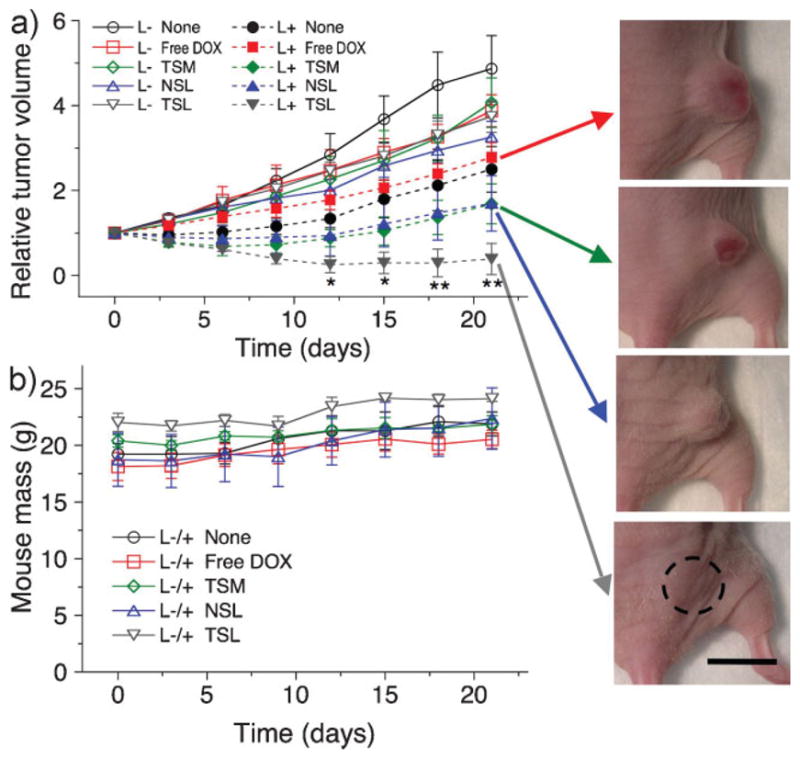
Tumor therapy using cooperative nanosystem. a) Relative tumor volume in different treatment groups (n = ~5–7 mice per trace) for MDA-MB-435 human melanoma tumors. Mice bearing bilateral MDA-MB-435 tumors were injected with GNRs (10 mg Au kg−1). After 72 h, a single dose of the indicated saline, free DOX, or various therapeutic nanoparticle formulations (3 mg DOX kg−1) was administered through tail vein injection and one tumor was irradiated with a NIR laser (810 nm, ~0.75 W cm−2) for 30 min, while maintaining an average tumor surface temperature of ~45 °C (monitored by IR thermographic surveillance). Tumor volumes were quantified every 3 d post-irradiation. The differences between TSL plus irradiation and all other groups were significant (*P <0.05 for 12 and 15 days and **P <0.02 for 18 and 21 days) in the tumor volume change curves. b) Representative images of treated tumors in the live animals for the indicated treatments (21 days post-treatment). Scale bar indicates 1 cm. c) Mouse mass as a function of days post-treatment for the indicated treatment groups. L+ and L− indicate animals whose tumors received NIR irradiation, or no irradiation, respectively, 72 h after GNR injection. Normal growth of all groups is observed for 3 weeks post-treatment. TSL, TSM, and NSL are the different nanoparticle formulations, defined in Figure 2.
References
-
- Weng KC, Noble CO, Papahadjopoulos-Sternberg B, Chen FF, Drummond DC, Kirpotin DB, Wang DH, Hom YK, Hann B, Park JW. Nano Lett. 2008;8:2851. - PubMed
-
- Tai LA, Tsai PJ, Wang YC, Wang YJ, Lo LW, Yang CS. Nanotechnology. 2009;20:135101. - PubMed
-
- Piao Y, Kim J, Bin Na H, Kim D, Baek JS, Ko MK, Lee JH, Shokouhimehr M, Hyeon T. Nat Mater. 2008;7:242. - PubMed
Publication types
MeSH terms
Substances
Grants and funding
LinkOut - more resources
Full Text Sources
Other Literature Sources
