

Anaplastic plasmacytomas: relationships to normal memory B cells and plasma cell neoplasms of immunodeficient and autoimmune mice
- PMID: 20217872
- PMCID: PMC3415987
- DOI: 10.1002/path.2692
Anaplastic plasmacytomas: relationships to normal memory B cells and plasma cell neoplasms of immunodeficient and autoimmune mice
Abstract
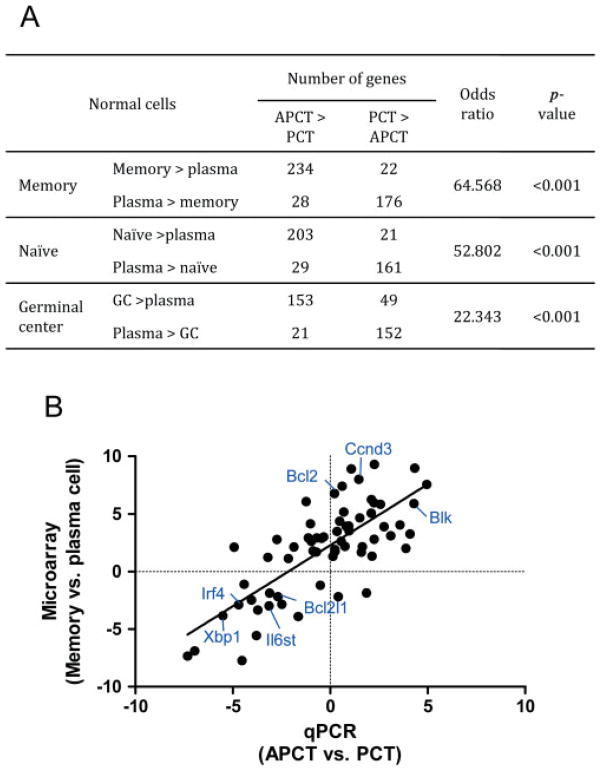
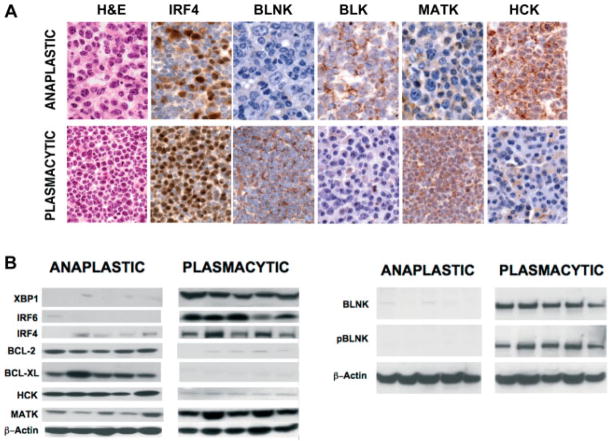
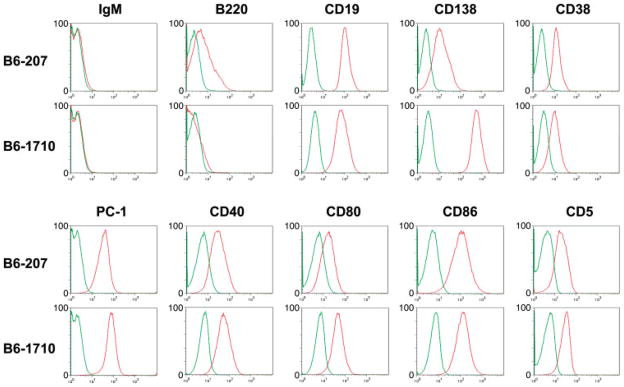
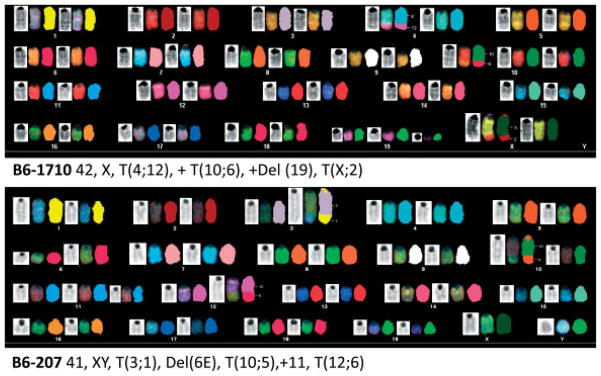
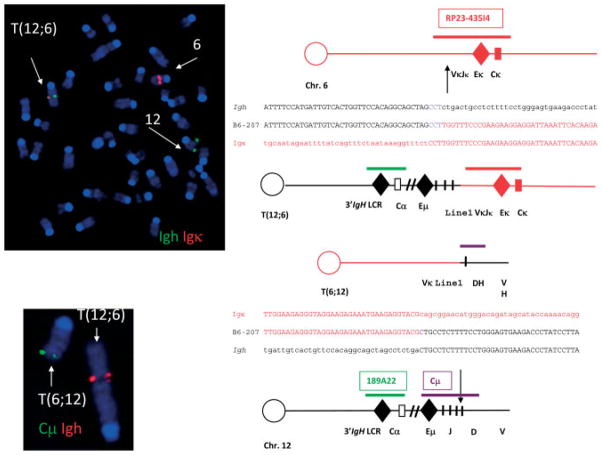
Anaplastic plasmacytomas (APCTs) from NFS.V(+) congenic mice and pristane-induced plasmacytic PCTs from BALB/c mice were previously shown to be histologically and molecularly distinct subsets of plasma cell neoplasms (PCNs). Here we extended these comparisons, contrasting primary APCTs and PCTs by gene expression profiling in relation to the expression profiles of normal naïve, germinal centre, and memory B cells and plasma cells. We also sequenced immunoglobulin genes from APCT and APCT-derived cell lines and defined surface phenotypes and chromosomal features of the cell lines by flow cytometry and by spectral karyotyping and fluorescence in situ hybridization. The results indicate that APCTs share many features with normal memory cells and the plasma cell-related neoplasms (PLs) of FASL-deficient mice, suggesting that APCTs and PLs are related and that both derive from memory B cells. Published in 2010 by John Wiley & Sons, Ltd.
Conflict of interest statement
No conflicts of interest were declared.
Figures
Comment in
-
Anaplastic plasmacytoma of mouse--establishing parallels between subtypes of mouse and human plasma cell neoplasia.J Pathol. 2010 Jul;221(3):242-7. doi: 10.1002/path.2714. J Pathol. 2010. PMID: 20527018 Free PMC article.
Similar articles
-
Anaplastic, plasmablastic, and plasmacytic plasmacytomas of mice: relationships to human plasma cell neoplasms and late-stage differentiation of normal B cells.Cancer Res. 2007 Mar 15;67(6):2439-47. doi: 10.1158/0008-5472.CAN-06-1561. Cancer Res. 2007. PMID: 17363561
-
Restricted immunoglobulin variable region (Ig V) gene expression accompanies secondary rearrangements of light chain Ig V genes in mouse plasmacytomas.J Exp Med. 1999 Nov 15;190(10):1405-16. doi: 10.1084/jem.190.10.1405. J Exp Med. 1999. PMID: 10562316 Free PMC article.
-
Distinct cellular pathways select germline-encoded and somatically mutated antibodies into immunological memory.J Exp Med. 2012 Oct 22;209(11):2079-97. doi: 10.1084/jem.20120127. Epub 2012 Oct 1. J Exp Med. 2012. PMID: 23027924 Free PMC article.
-
Germinal-center-derived B-cell memory.Adv Exp Med Biol. 2007;590:139-48. doi: 10.1007/978-0-387-34814-8_10. Adv Exp Med Biol. 2007. PMID: 17191383 Review. No abstract available.
-
In vitro analysis of the generation and propagation of memory B cells.Immunol Rev. 1996 Apr;150:91-111. doi: 10.1111/j.1600-065x.1996.tb00697.x. Immunol Rev. 1996. PMID: 8782703 Review. No abstract available.
Cited by
-
Eef1a2 promotes cell growth, inhibits apoptosis and activates JAK/STAT and AKT signaling in mouse plasmacytomas.PLoS One. 2010 May 21;5(5):e10755. doi: 10.1371/journal.pone.0010755. PLoS One. 2010. PMID: 20505761 Free PMC article.
-
Successful outcome of anaplastic multiple myeloma with lenalidomide, cyclophosphamide, and dexamethasone therapy.Ann Hematol. 2021 Dec;100(12):3039-3040. doi: 10.1007/s00277-020-04244-7. Epub 2020 Sep 2. Ann Hematol. 2021. PMID: 32876702 No abstract available.
-
Waldenström macroglobulinemia: clinical and immunological aspects, natural history, cell of origin, and emerging mouse models.ISRN Hematol. 2013 Sep 9;2013:815325. doi: 10.1155/2013/815325. ISRN Hematol. 2013. PMID: 24106612 Free PMC article. Review.
-
Differentiation of rodent immune and hematopoietic system reactive lesions from neoplasias.Toxicol Pathol. 2012 Apr;40(3):425-34. doi: 10.1177/0192623311431467. Epub 2012 Jan 3. Toxicol Pathol. 2012. PMID: 22215512 Free PMC article. Review.
-
Anaplastic plasmacytoma of mouse--establishing parallels between subtypes of mouse and human plasma cell neoplasia.J Pathol. 2010 Jul;221(3):242-7. doi: 10.1002/path.2714. J Pathol. 2010. PMID: 20527018 Free PMC article.
References
-
- Swerdlow SH, Campo E, Harris NL, Jaffe E, Pileri SA, Stein H, et al. WHO Classification of Tumours of Haematopoietic and Lymphoid Tissues. WHO Press; Geneva: 2008.
-
- Potter M. Neoplastic development in plasma cells. Immunol Rev. 2003;194:177–195. - PubMed
-
- Bergsagel PL, Kuehl WM. Chromosome translocations in multiple myeloma. Oncogene. 2001;20:5611–5622. - PubMed
-
- Hong DS, Angelo LS, Kurzrock R. Interleukin-6 and its receptor in cancer: implications for translational therapeutics. Cancer. 2007;110:1911–1928. - PubMed
Publication types
MeSH terms
Substances
Grants and funding
LinkOut - more resources
Full Text Sources
Molecular Biology Databases
Research Materials
