

Elucidation of amyloid beta-protein oligomerization mechanisms: discrete molecular dynamics study
- PMID: 20218566
- PMCID: PMC5767167
- DOI: 10.1021/ja9096303
Elucidation of amyloid beta-protein oligomerization mechanisms: discrete molecular dynamics study
Abstract
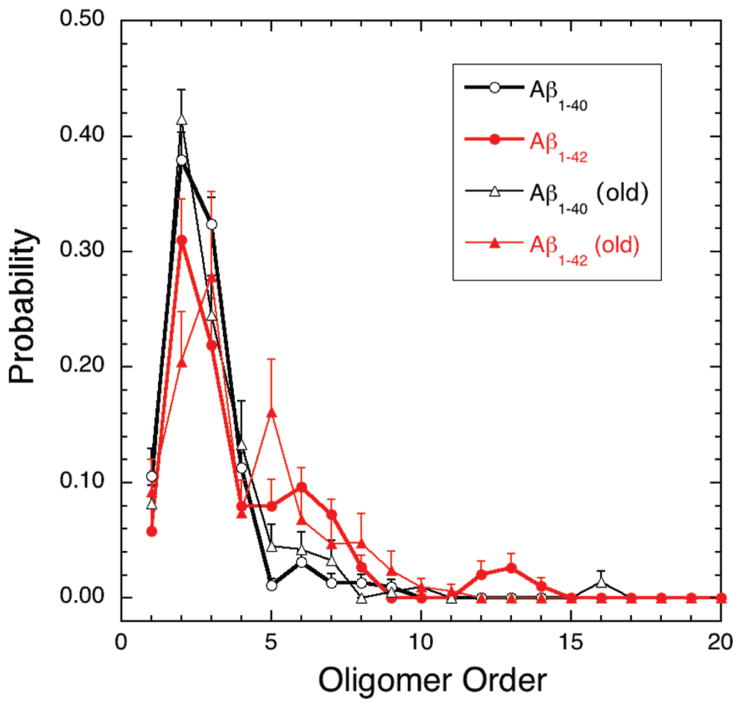
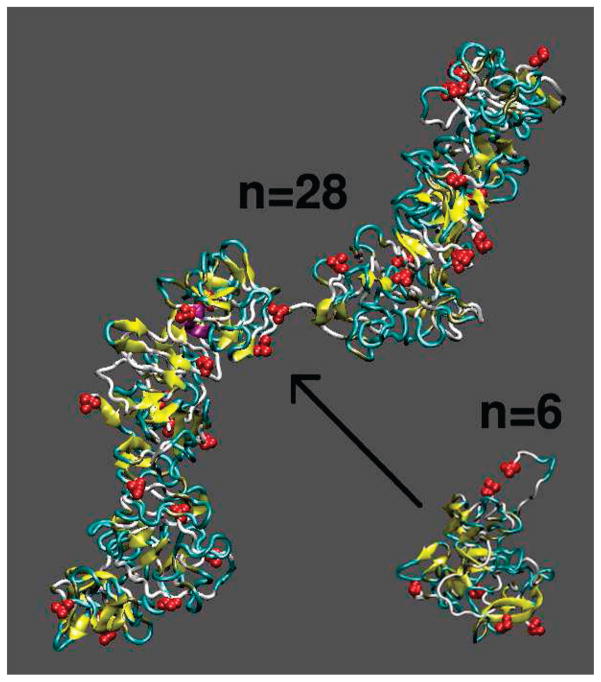
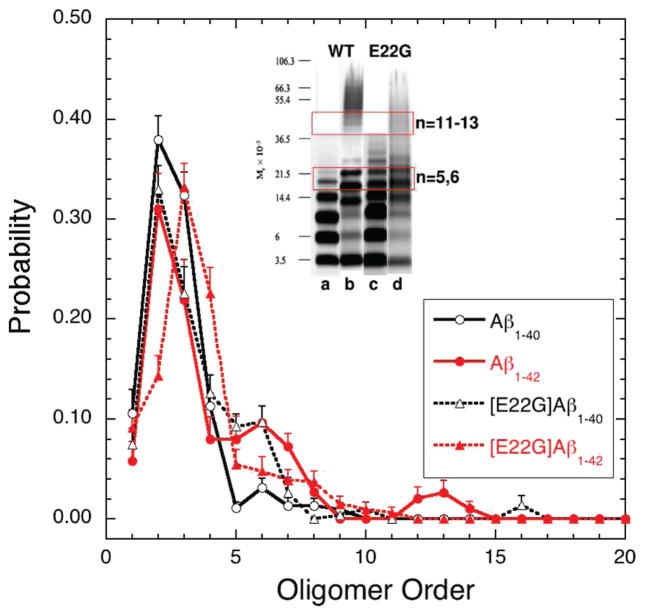
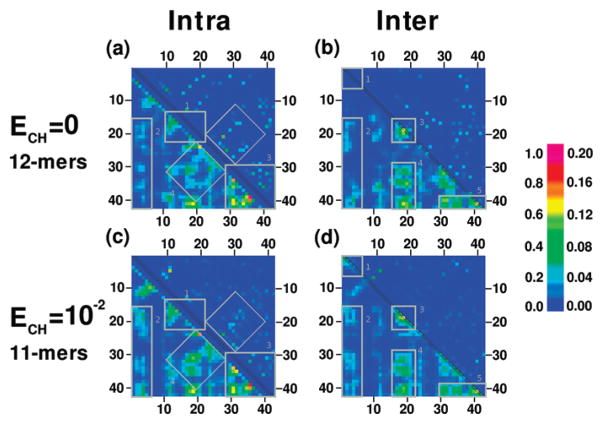
Oligomers of amyloid beta-protein (Abeta) play a central role in the pathology of Alzheimer's disease. Of the two predominant Abeta alloforms, Abeta(1-40) and Abeta(1-42), Abeta(1-42) is more strongly implicated in the disease. We elucidated the structural characteristics of oligomers of Abeta(1-40) and Abeta(1-42) and their Arctic mutants, [E22G]Abeta(1-40) and [E22G]Abeta(1-42). We simulated oligomer formation using discrete molecular dynamics (DMD) with a four-bead protein model, backbone hydrogen bonding, and residue-specific interactions due to effective hydropathy and charge. For all four peptides under study, we derived the characteristic oligomer size distributions that were in agreement with prior experimental findings. Unlike Abeta(1-40), Abeta(1-42) had a high propensity to form paranuclei (pentameric or hexameric) structures that could self-associate into higher-order oligomers. Neither of the Arctic mutants formed higher-order oligomers, but [E22G]Abeta(1-40) formed paranuclei with a similar propensity to that of Abeta(1-42). Whereas the best agreement with the experimental data was obtained when the charged residues were modeled as solely hydrophilic, further assembly from spherical oligomers into elongated protofibrils was induced by nonzero electrostatic interactions among the charged residues. Structural analysis revealed that the C-terminal region played a dominant role in Abeta(1-42) oligomer formation whereas Abeta(1-40) oligomerization was primarily driven by intermolecular interactions among the central hydrophobic regions. The N-terminal region A2-F4 played a prominent role in Abeta(1-40) oligomerization but did not contribute to the oligomerization of Abeta(1-42) or the Arctic mutants. The oligomer structure of both Arctic peptides resembled Abeta(1-42) more than Abeta(1-40), consistent with their potentially more toxic nature.
Figures


Similar articles
-
Effects of the Arctic (E22-->G) mutation on amyloid beta-protein folding: discrete molecular dynamics study.J Am Chem Soc. 2008 Dec 24;130(51):17413-22. doi: 10.1021/ja804984h. J Am Chem Soc. 2008. PMID: 19053400
-
Dimer formation enhances structural differences between amyloid β-protein (1-40) and (1-42): an explicit-solvent molecular dynamics study.PLoS One. 2012;7(4):e34345. doi: 10.1371/journal.pone.0034345. Epub 2012 Apr 11. PLoS One. 2012. PMID: 22509291 Free PMC article.
-
Oligomer Formation of Amyloid-β(29-42) from Its Monomers Using the Hamiltonian Replica-Permutation Molecular Dynamics Simulation.J Phys Chem B. 2016 Jul 14;120(27):6555-61. doi: 10.1021/acs.jpcb.6b03828. Epub 2016 Jun 24. J Phys Chem B. 2016. PMID: 27281682
-
Elucidating the Structures of Amyloid Oligomers with Macrocyclic β-Hairpin Peptides: Insights into Alzheimer's Disease and Other Amyloid Diseases.Acc Chem Res. 2018 Mar 20;51(3):706-718. doi: 10.1021/acs.accounts.7b00554. Epub 2018 Mar 6. Acc Chem Res. 2018. PMID: 29508987 Free PMC article. Review.
-
Understanding amyloid fibril nucleation and aβ oligomer/drug interactions from computer simulations.Acc Chem Res. 2014 Feb 18;47(2):603-11. doi: 10.1021/ar4002075. Epub 2013 Dec 24. Acc Chem Res. 2014. PMID: 24368046 Review.
Cited by
-
Ubiquitous amyloids.Appl Biochem Biotechnol. 2012 Apr;166(7):1626-43. doi: 10.1007/s12010-012-9549-3. Epub 2012 Feb 19. Appl Biochem Biotechnol. 2012. PMID: 22350870 Free PMC article. Review.
-
Effects of familial mutations on the monomer structure of Aβ₄₂.Biophys J. 2012 Dec 19;103(12):L47-9. doi: 10.1016/j.bpj.2012.11.009. Epub 2012 Dec 18. Biophys J. 2012. PMID: 23260058 Free PMC article.
-
Molecular Dynamics Simulation Studies on the Aggregation of Amyloid-β Peptides and Their Disaggregation by Ultrasonic Wave and Infrared Laser Irradiation.Molecules. 2022 Apr 12;27(8):2483. doi: 10.3390/molecules27082483. Molecules. 2022. PMID: 35458686 Free PMC article. Review.
-
Amyloid β-protein oligomers and Alzheimer's disease.Alzheimers Res Ther. 2013 Nov 29;5(6):60. doi: 10.1186/alzrt226. eCollection 2013. Alzheimers Res Ther. 2013. PMID: 24289820 Free PMC article. Review.
-
The role of molecular simulations in the development of inhibitors of amyloid β-peptide aggregation for the treatment of Alzheimer's disease.ACS Chem Neurosci. 2012 Nov 21;3(11):845-56. doi: 10.1021/cn300091a. Epub 2012 Aug 27. ACS Chem Neurosci. 2012. PMID: 23173066 Free PMC article. Review.
References
-
-
We note that “order” generally is used herein to define the number of Aβ monomers comprising a particular assembly. Unless stated otherwise, order does not refer to secondary or tertiary structure characteristics.
-
-
- Hardy J, Selkoe DJ. Science. 2002;297:353–356. - PubMed
-
- Hardy J. Ann Neurol. 2003;54:143–144. - PubMed
-
- Dahlgren KN, Manelli AM, Stine WB, Baker LK, Krafft GA, LaDu MJ. J Biol Chem. 2002;277:32046–32053. - PubMed
