

Genistein synergizes with arsenic trioxide to suppress human hepatocellular carcinoma
- PMID: 20219070
- PMCID: PMC11159316
- DOI: 10.1111/j.1349-7006.2009.01464.x
Genistein synergizes with arsenic trioxide to suppress human hepatocellular carcinoma
Erratum in
- Cancer Sci. 2010 Jun;101(6):1574
Abstract
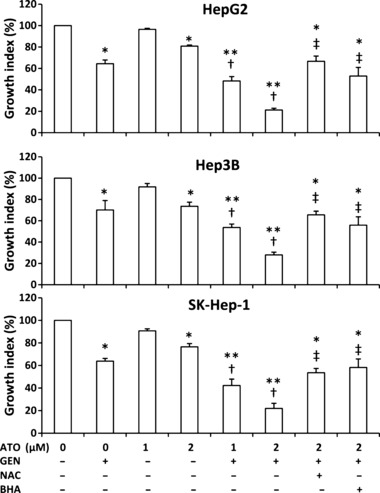
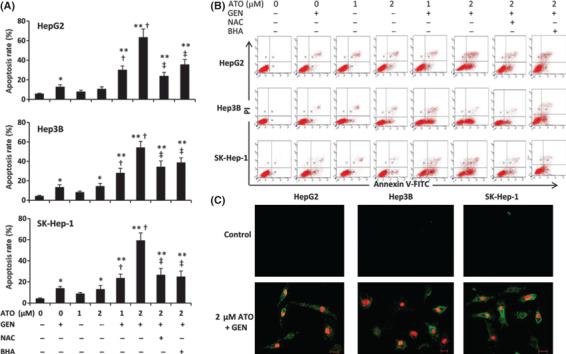
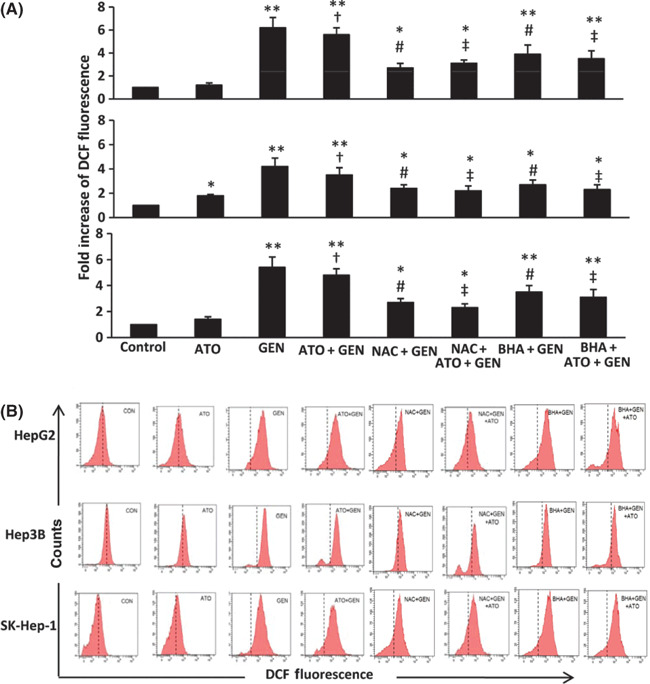
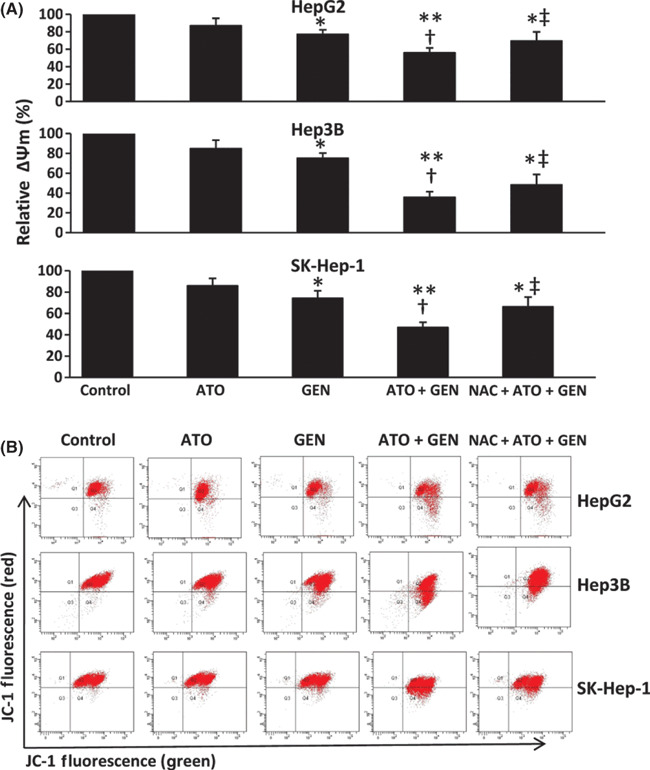
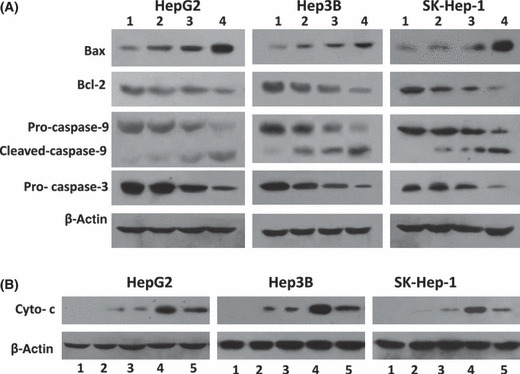
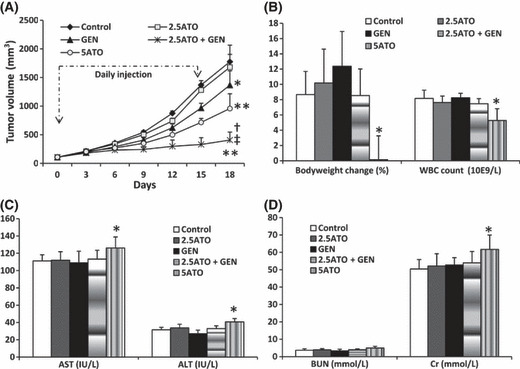
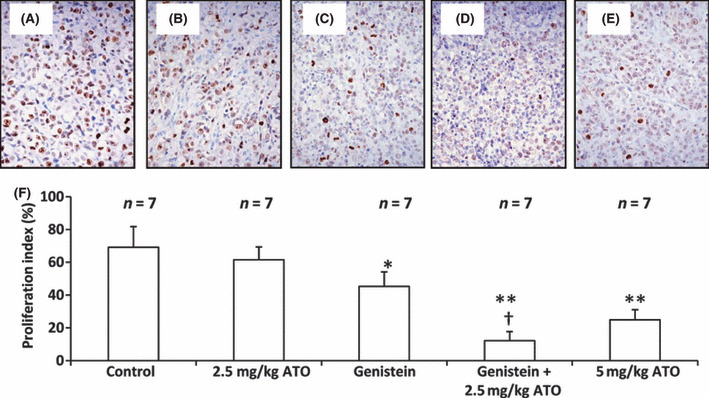
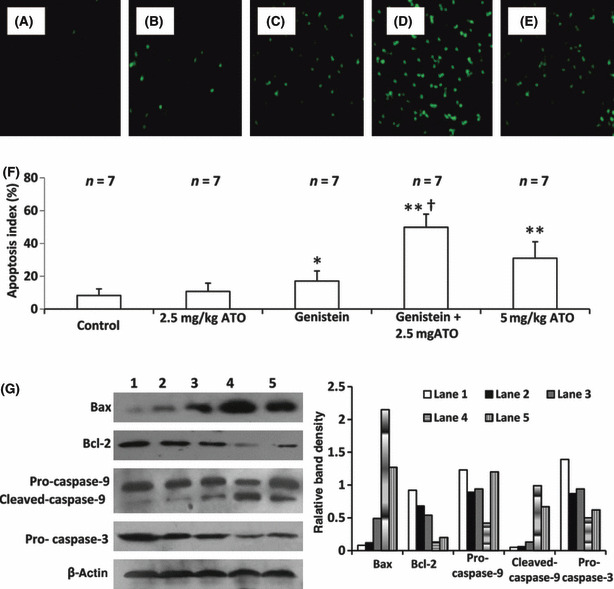
Arsenic trioxide (ATO) is of limited therapeutic benefit for the treatment of solid tumors. Genistein exhibits anticancer and pro-oxidant activities, making it a potential candidate to enhance the efficacy of ATO whose cytotoxicity is oxidation-sensitive. This study sought to determine whether genistein synergizes with ATO to combat hepatocellular carcinoma (HCC). Three human HCC cell lines, namely HepG2, Hep3B, and SK-Hep-1, were incubated with ATO, genistein, or ATO + genistein. The cells were also pretreated with antioxidant agents N-acetyl-L-cysteine (NAC) or butylated hydroxyanisole (BHA). Cell viability, apoptosis, intracellular reactive oxygen species (ROS), mitochondrial membrane potential (DeltaPsim), expression of Bcl-2, Bax, caspase-9, and -3, and release of cytochrome c into the cytosol were examined. The synergistic effect of ATO and genistein was also assessed using HepG2 xenografts subcutaneously established in BALB/c nude mice. The results show that genistein synergized with ATO to reduce viability, induce apoptosis, and diminish the DeltaPsim of cells. The combination therapy down-regulated Bcl-2 expression, up-regulated Bax expression, enhanced the activation of caspase-9 and -3, and increased the release of cytochrome c. The synergistic effect of ATO and genistein was diminished by pretreatment with NAC or BHA. Genistein increased the production of intracellular ROS, while ATO had little effect. Genistein synergized with a low dose of ATO (2.5 mg/kg) to significantly inhibit the growth of HepG2 tumors, and suppress cell proliferation and induce apoptosis in situ. There were no obvious side effects, as seen with a high dose of ATO (5 mg/kg). Combining genistein with ATO warrants investigation as a therapeutic strategy to combat HCC.
Figures
Similar articles
-
Icariin synergizes with arsenic trioxide to suppress human hepatocellular carcinoma.Cell Biochem Biophys. 2014 Mar;68(2):427-36. doi: 10.1007/s12013-013-9724-3. Cell Biochem Biophys. 2014. PMID: 23975599
-
Shikonin potentiates the effect of arsenic trioxide against human hepatocellular carcinoma in vitro and in vivo.Oncotarget. 2016 Oct 25;7(43):70504-70515. doi: 10.18632/oncotarget.12041. Oncotarget. 2016. PMID: 27655700 Free PMC article.
-
Genistein selectively potentiates arsenic trioxide-induced apoptosis in human leukemia cells via reactive oxygen species generation and activation of reactive oxygen species-inducible protein kinases (p38-MAPK, AMPK).Int J Cancer. 2008 Sep 1;123(5):1205-14. doi: 10.1002/ijc.23639. Int J Cancer. 2008. PMID: 18546268
-
Genistein potentiates the effect of arsenic trioxide against human hepatocellular carcinoma: role of Akt and nuclear factor-κB.Cancer Lett. 2011 Feb 1;301(1):75-84. doi: 10.1016/j.canlet.2010.10.022. Cancer Lett. 2011. PMID: 21078540
-
Nanocarrier-based delivery of arsenic trioxide for hepatocellular carcinoma therapy.Nanomedicine (Lond). 2022 Nov;17(26):2037-2054. doi: 10.2217/nnm-2022-0250. Epub 2023 Feb 15. Nanomedicine (Lond). 2022. PMID: 36789952 Review.
Cited by
-
Integrating network toxicology and molecular docking to explore the toxicity of the environmental pollutant butyl hydroxyanisole: An example of induction of chronic urticaria.Heliyon. 2024 Jul 30;10(15):e35409. doi: 10.1016/j.heliyon.2024.e35409. eCollection 2024 Aug 15. Heliyon. 2024. PMID: 39170477 Free PMC article.
-
Taxifolin enhances andrographolide-induced mitotic arrest and apoptosis in human prostate cancer cells via spindle assembly checkpoint activation.PLoS One. 2013;8(1):e54577. doi: 10.1371/journal.pone.0054577. Epub 2013 Jan 28. PLoS One. 2013. PMID: 23382917 Free PMC article.
-
Novel Investigations of Flavonoids as Chemopreventive Agents for Hepatocellular Carcinoma.Biomed Res Int. 2015;2015:840542. doi: 10.1155/2015/840542. Epub 2015 Dec 16. Biomed Res Int. 2015. PMID: 26858957 Free PMC article. Review.
-
PGC-1α Protects against Hepatic Ischemia Reperfusion Injury by Activating PPARα and PPARγ and Regulating ROS Production.Oxid Med Cell Longev. 2021 May 19;2021:6677955. doi: 10.1155/2021/6677955. eCollection 2021. Oxid Med Cell Longev. 2021. PMID: 34104311 Free PMC article.
-
Bufalin Reverses Resistance to Sorafenib by Inhibiting Akt Activation in Hepatocellular Carcinoma: The Role of Endoplasmic Reticulum Stress.PLoS One. 2015 Sep 18;10(9):e0138485. doi: 10.1371/journal.pone.0138485. eCollection 2015. PLoS One. 2015. PMID: 26381511 Free PMC article.
References
-
- Parkin DM, Bray F, Ferlay J et al. Global cancer statistics, 2002. CA Cancer J Clin 2005; 55: 74–108. - PubMed
-
- Roberts LR. Sorafenib in liver cancer – just the beginning. N Engl J Med 2008; 359: 420–2. - PubMed
-
- Newell P, Villanueva A, Llovet JM. Molecular targeted therapies in hepatocellular carcinoma: from pre‐clinical models to clinical trials. J Hepatol 2008; 49: 1–5. - PubMed
-
- Pang RW, Poon RT. From molecular biology to targeted therapies for hepatocellular carcinoma: the future is now. Oncology 2007; 72 (Suppl 1): 30–44. - PubMed
Publication types
MeSH terms
Substances
LinkOut - more resources
Full Text Sources
Medical
Research Materials
