

Specific and rapid effects of acoustic stimulation on the tonotopic distribution of Kv3.1b potassium channels in the adult rat
- PMID: 20219640
- PMCID: PMC2854512
- DOI: 10.1016/j.neuroscience.2010.02.046
Specific and rapid effects of acoustic stimulation on the tonotopic distribution of Kv3.1b potassium channels in the adult rat
Abstract
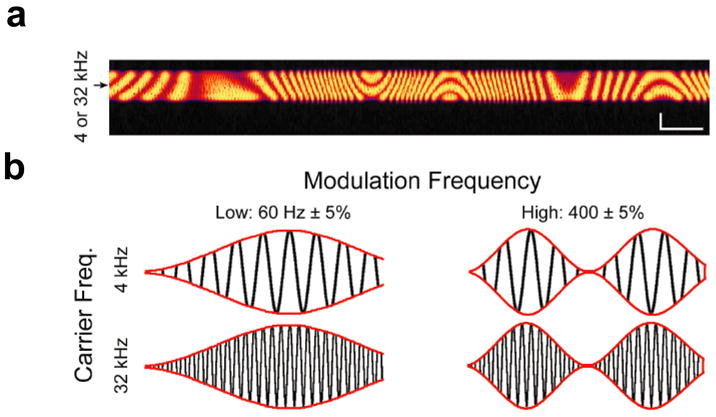
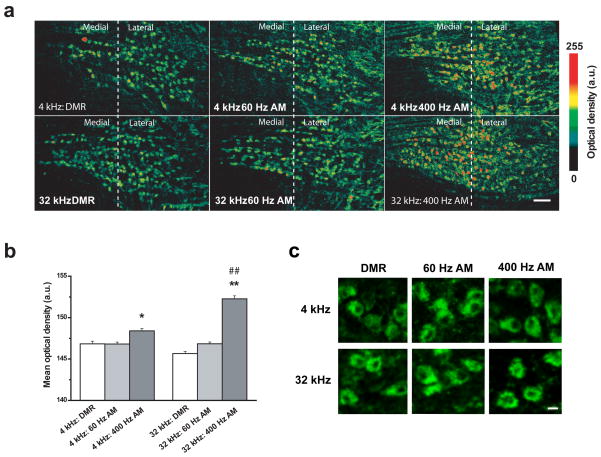
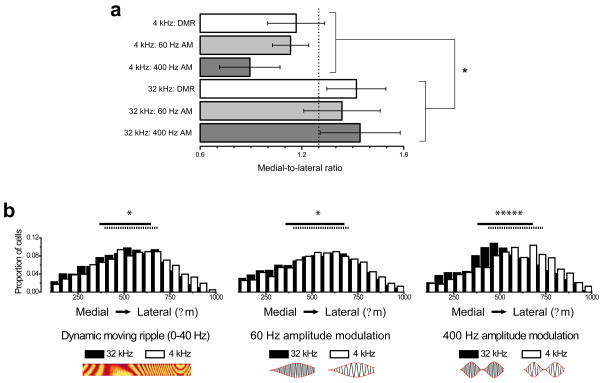
Recent studies have demonstrated that total cellular levels of voltage-gated potassium channel subunits can change on a time scale of minutes in acute slices and cultured neurons, raising the possibility that rapid changes in the abundance of channel proteins contribute to experience-dependent plasticity in vivo. In order to investigate this possibility, we took advantage of the medial nucleus of the trapezoid body (MNTB) sound localization circuit, which contains neurons that precisely phase-lock their action potentials to rapid temporal fluctuations in the acoustic waveform. Previous work has demonstrated that the ability of these neurons to follow high-frequency stimuli depends critically upon whether they express adequate amounts of the potassium channel subunit Kv3.1. To test the hypothesis that net amounts of Kv3.1 protein would be rapidly upregulated when animals are exposed to sounds that require high frequency firing for accurate encoding, we briefly exposed adult rats to acoustic environments that varied according to carrier frequency and amplitude modulation (AM) rate. Using an antibody directed at the cytoplasmic C-terminus of Kv3.1b (the adult splice isoform of Kv3.1), we found that total cellular levels of Kv3.1b protein-as well as the tonotopic distribution of Kv3.1b-labeled cells-was significantly altered following 30 min of exposure to rapidly modulated (400 Hz) sounds relative to slowly modulated (0-40 Hz, 60 Hz) sounds. These results provide direct evidence that net amounts of Kv3.1b protein can change on a time scale of minutes in response to stimulus-driven synaptic activity, permitting auditory neurons to actively adapt their complement of ion channels to changes in the acoustic environment.
Copyright 2010 IBRO. Published by Elsevier Ltd. All rights reserved.
Figures
Similar articles
-
Fragile X mental retardation protein is required for rapid experience-dependent regulation of the potassium channel Kv3.1b.J Neurosci. 2010 Aug 4;30(31):10263-71. doi: 10.1523/JNEUROSCI.1125-10.2010. J Neurosci. 2010. PMID: 20685971 Free PMC article.
-
Modulation of Kv3.1b potassium channel phosphorylation in auditory neurons by conventional and novel protein kinase C isozymes.J Biol Chem. 2006 Jun 2;281(22):15582-91. doi: 10.1074/jbc.M512866200. Epub 2006 Apr 4. J Biol Chem. 2006. PMID: 16595659
-
Localization of two high-threshold potassium channel subunits in the rat central auditory system.J Comp Neurol. 2001 Aug 20;437(2):196-218. doi: 10.1002/cne.1279. J Comp Neurol. 2001. PMID: 11494252
-
Kv3 Channels: Enablers of Rapid Firing, Neurotransmitter Release, and Neuronal Endurance.Physiol Rev. 2017 Oct 1;97(4):1431-1468. doi: 10.1152/physrev.00002.2017. Physiol Rev. 2017. PMID: 28904001 Free PMC article. Review.
-
Going native: voltage-gated potassium channels controlling neuronal excitability.J Physiol. 2010 Sep 1;588(Pt 17):3187-200. doi: 10.1113/jphysiol.2010.191973. Epub 2010 Jun 2. J Physiol. 2010. PMID: 20519310 Free PMC article. Review.
Cited by
-
Decreased temporal precision of neuronal signaling as a candidate mechanism of auditory processing disorder.Hear Res. 2015 Dec;330(Pt B):213-20. doi: 10.1016/j.heares.2015.06.014. Epub 2015 Jun 25. Hear Res. 2015. PMID: 26119177 Free PMC article. Review.
-
Developmental Emergence of Phenotypes in the Auditory Brainstem Nuclei of Fmr1 Knockout Mice.eNeuro. 2017 Dec 27;4(6):ENEURO.0264-17.2017. doi: 10.1523/ENEURO.0264-17.2017. eCollection 2017 Nov-Dec. eNeuro. 2017. PMID: 29291238 Free PMC article.
-
Sound stimulation modulates high-threshold K(+) currents in mouse auditory brainstem neurons.Eur J Neurosci. 2010 Nov;32(10):1658-67. doi: 10.1111/j.1460-9568.2010.07437.x. Epub 2010 Oct 14. Eur J Neurosci. 2010. PMID: 20946234 Free PMC article.
-
Modulators of Kv3 Potassium Channels Rescue the Auditory Function of Fragile X Mice.J Neurosci. 2019 Jun 12;39(24):4797-4813. doi: 10.1523/JNEUROSCI.0839-18.2019. Epub 2019 Apr 1. J Neurosci. 2019. PMID: 30936239 Free PMC article.
-
Mechanisms underlying auditory processing deficits in Fragile X syndrome.FASEB J. 2020 Mar;34(3):3501-3518. doi: 10.1096/fj.201902435R. Epub 2020 Feb 10. FASEB J. 2020. PMID: 32039504 Free PMC article. Review.
References
-
- Brew HM, Forsythe ID. Systematic variation of potassium current amplitudes across the tonotopic axis of the rat medial nucleus of the trapezoid body. Hear Res. 2005;206:116–132. - PubMed
-
- Darnell JC, Jensen KB, Jin P, Brown V, Warren ST, Darnell RB. Fragile X mental retardation protein targets G quartet mRNAs important for neuronal function. Cell. 2001;107:489–499. - PubMed
-
- Elezgarai I, Diez J, Puente N, Azkue JJ, Benitez R, Bilbao A, Knopfel T, Donate-Oliver F, Grandes P. Subcellular localization of the voltage-dependent potassium channel Kv3.1b in postnatal and adult rat medial nucleus of the trapezoid body. Neuroscience. 2003;118:889–898. - PubMed
Publication types
MeSH terms
Substances
Grants and funding
LinkOut - more resources
Full Text Sources
Other Literature Sources
Molecular Biology Databases
