. 2010 May;84(10):5314-28.
doi: 10.1128/JVI.02329-09. Epub 2010 Mar 10.

Preclinical studies of a modified vaccinia virus Ankara-based HIV candidate vaccine: antigen presentation and antiviral effect

Affiliations

Preclinical studies of a modified vaccinia virus Ankara-based HIV candidate vaccine: antigen presentation and antiviral effect

Samantha Brandler et al. J Virol. 2010 May.

Abstract

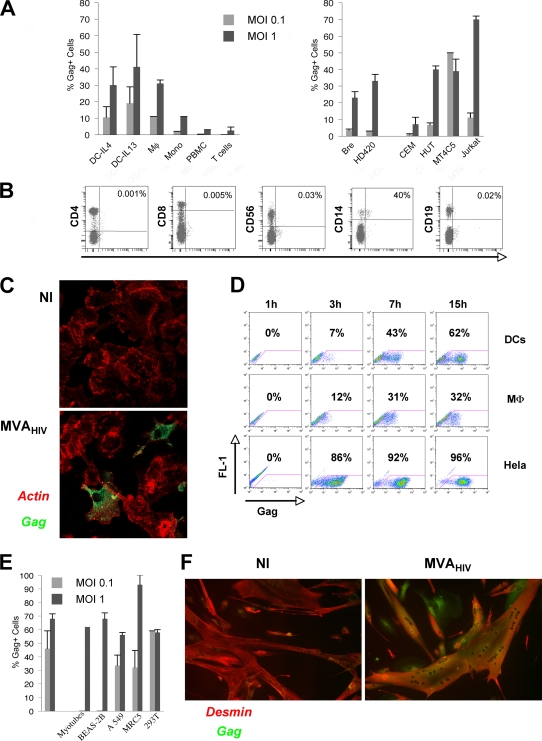
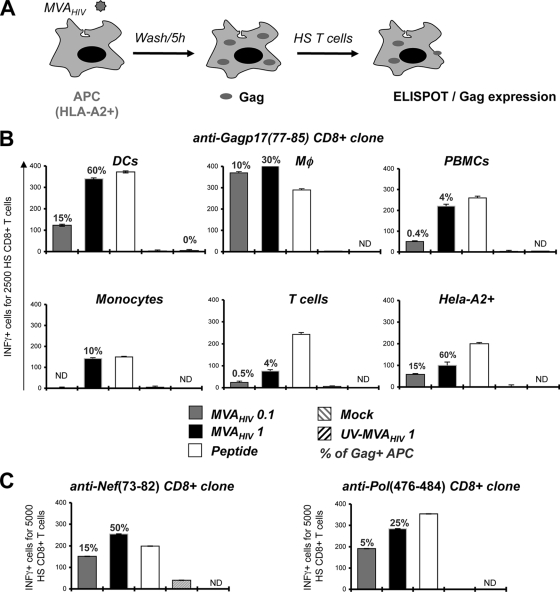
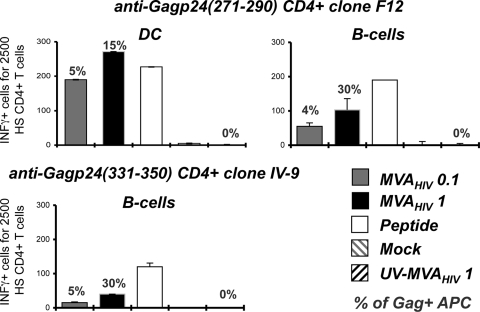
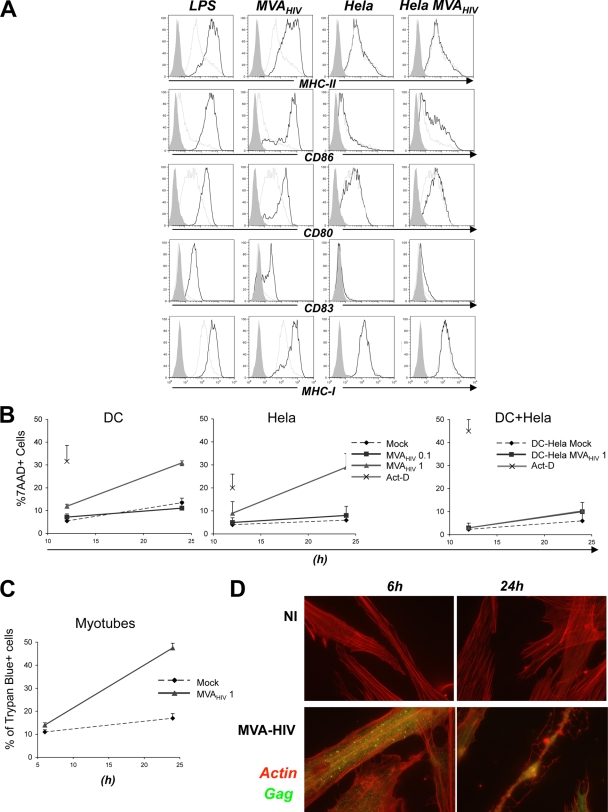
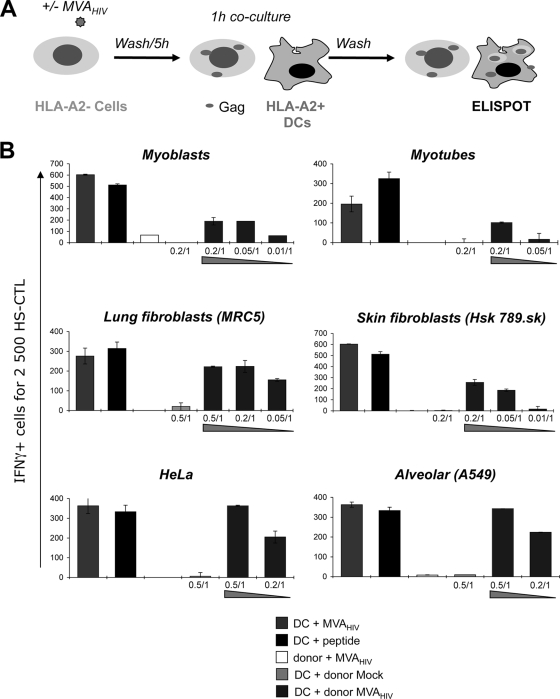
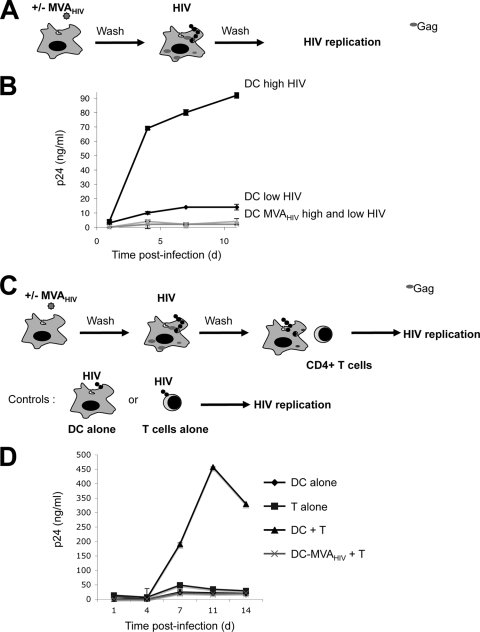
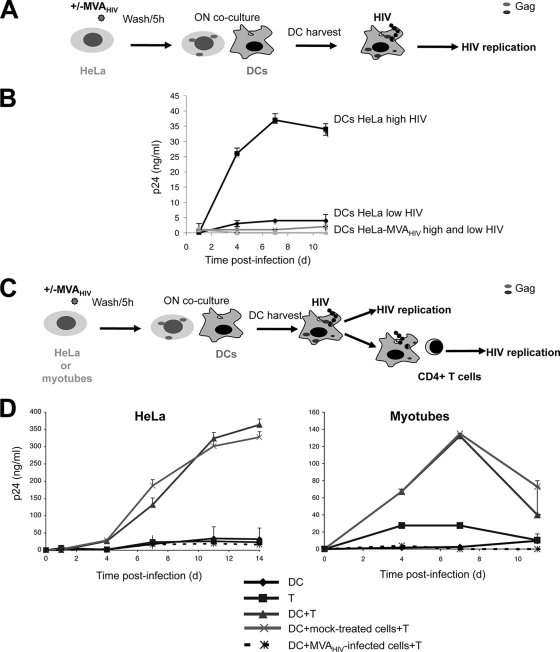
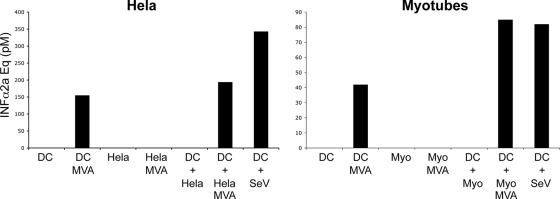
Poxvirus-based human immunodeficiency virus (HIV) vaccine candidates are currently under evaluation in preclinical and clinical trials. Modified vaccinia virus Ankara (MVA) vectors have excellent safety and immunogenicity records, but their behavior in human cell cultures remains only partly characterized. We studied here various virological and immunological aspects of the interactions of MVA-HIV, a vaccine candidate developed by the French National Agency for AIDS Research (ANRS), with primary human cells. We report that MVA-HIV infects and drives Gag expression in primary macrophages, dendritic cells (DCs), and epithelial and muscle cells. MVA-HIV-infected DCs matured, efficiently presented Gag, Pol, and Nef antigens, and activated HIV-specific cytotoxic T lymphocytes (CTLs). As expected with this type of vector, infection was cytopathic and led to DC apoptosis. Coculture of MVA-HIV-infected epithelial cells or myotubes with DCs promoted efficient Gag antigen major histocompatibility complex class I (MHC-I) cross-presentation without inducing direct infection and death of DCs. Antigen-presenting cells (APCs) infected with MVA-HIV also activated HIV-specific CD4(+) T cells. Moreover, exposure of DCs to MVA-HIV or to MVA-HIV-infected myotubes induced type I interferon (IFN) production and inhibited subsequent HIV replication and transfer to lymphocytes. Altogether, these results show that MVA-HIV promotes efficient MHC-I and MHC-II presentation of HIV antigens by APCs without facilitating HIV replication. Deciphering the immune responses to MVA in culture experiments will help in the design of innovative vaccine strategies.


Figures

FIG. 1.
FIG. 1.
MVA-HIV preferentially infects APCs and vaccination target cells. (A) Gag expression in primary cells (left) or in cell lines (right) after MVA-HIV infection at the indicated MOI. At 15 h p.i., cells were stained for intracellular HIV Gag and analyzed by flow cytometry. DCs were differentiated in the presence of IL-4 or IL-13. The data represent the means ± standard deviations (SD) for at least three independent experiments. (B) PBMCs were infected with MVA-HIV (MOI = 1). At 15 h p.i., cells were stained for cell surface markers and intracellular HIV Gag and analyzed by flow cytometry. Uninfected PBMCs and isotype-matched Abs were used as negative controls (not shown). T cells, CD8+ and CD4+ cells; NK cells, CD56+ cells; monocytes, CD14+ cells; B cells, CD19+ cells. The percentages of Gag+ cells in the corresponding cell subsets are shown. The data are representative of three independent experiments. (C) DCs were infected with MVA-HIV (MOI = 0.1), and HIV Gag expression was further analyzed by immunofluorescence and confocal microscopy. Green, HIV Gag staining; red, actin-phalloidin-PE. NI, not infected. (D) Kinetics of HIV Gag expression in DCs, macrophages (MD-M), and HeLa cells analyzed as described for panel A. (E) HIV Gag expression in primary myotubes and epithelial cells 15 h after MVA-HIV infection (MOI = 1), assessed using flow cytometry and immunofluorescence for myotubes. The data represent the means ± SD for at least three independent experiments. (F) Myotubes were infected with MVA-HIV (MOI = 1), and HIV Gag expression was analyzed by immunofluorescence and confocal microscopy. Green, HIV Gag staining; red, anti-desmin MAb to identify myotubes. NI, not infected.
FIG. 2.
FIG. 2.
MVA-HIV-infected cells directly present antigens to HS CTLs. (A) Experimental procedure. APCs were loaded (1 h) with MVA-HIV, UV-inactivated MVA-HIV (at the indicated MOI), or peptide (1 μg/ml) or mock treated and then were washed, seeded for 5 h to allow HIV antigen expression, and cocultured for at least 8 h with HS T cells. T-cell activation was monitored by IFN-γ ELISPOT assay. (B) The CTL clone EM40-F21, specific for Gag, was used to test the capacity of diverse MVA-HIV-infected cell types to present HIV Gag-derived antigens. (C) MVA-HIV-infected APCs present Pol- and Nef-derived epitopes, leading to CTL activation. The CTL lines IV9 and P1, specific for Pol aa 476 to 484 and Nef aa 73 to 82, respectively, were cocultured with autologous B-cell lines, and T-cell activation was monitored by IFN-γ ELISPOT assay. Background IFN-γ production by target cells alone was subtracted and was at least three times lower than that with HS T cells. For each panel, data are means ± SD for triplicates and are representative of at least 2 independent experiments. Percentages of HIV Gag+ APCs, determined by flow cytometry at the end of the coculture period, are indicated.
FIG. 3.
FIG. 3.
MVA-HIV-infected cells directly present antigens to HS CD4+ T cells. As in Fig. 2, MVA-HIV-infected DCs and B cells were used to activate the HS CD4+ T-cell clone F12, which is specific for the Gag p24(271-290) amino acid sequence. MVA-HIV-infected B cells were used to stimulate the IV-9 clone, which is specific for Gag p24(331-350). T-cell activation was monitored by IFN-γ ELISPOT assay. Background IFN-γ production by target cells alone was subtracted and was at least three times lower than that with HS T cells. For each panel, data are means ± SD for triplicates and are representative of at least 2 independent experiments. Percentages of HIV Gag+ APCs, determined by flow cytometry at the end of the coculture period, are indicated.
FIG. 4.
FIG. 4.
Effects of MVA-HIV on DC maturation and cell viability. (A) MVA-HIV promotes DC maturation. DCs were mock treated or infected with MVA-HIV (MOI of 1 for 1 h), washed, and incubated for 24 h in cell culture medium. As a positive control, DC maturation was induced using LPS (1 μg/ml; Sigma). For the coculture experiments, HeLa cells were infected with MVA-HIV (1 h), washed extensively, seeded for 6 h to allow MVA-HIV internalization, and cocultured with DCs for 24 h. DCs were then harvested, stained with the indicated Abs, and analyzed by FACS to monitor DC maturation. Histograms represent DC maturation within viable cells. Shaded histograms, isotype-matched Ab controls; gray lines, mock-treated imDCs; dark lines, DCs treated with the indicated stimuli. The data are representative of three independent experiments. (B) MVA-HIV induces apoptosis of infected cells. DCs and HeLa cells were infected with MVA-HIV at the indicated MOI (1 h), washed three times, and seeded in cell culture medium. Coculture experiments were performed as described for panel A. At the indicated time points, DCs exposed to MVA-HIV or MVA-HIV-infected HeLa cells were harvested and cell viability analyzed using 7-AAD and FACS. As a positive control for the induction of cell death, cells were treated with actinomycin D (Act-D; 1 μg/ml) for 12 h. Cell mortality is expressed as the percentage of 7-AAD+ cells (cells were gated to exclude cellular debris). Data are means ± SD for 3 independent experiments. (C) Primary myotubes were treated as in panel B, and cell viability was analyzed using trypan blue exclusion. Cell mortality is expressed as the percentage of trypan blue-positive cells. Data are means ± SD for duplicates and are representative of 2 independent experiments. (D) Primary myotubes used for panel C were stained intracellularly for HIV Gag and using actin-phalloidin-PE and were analyzed by confocal microscopy. Data are representative of 3 independent experiments.
FIG. 5.
FIG. 5.
MVA-HIV-infected cells are cross-presented by DCs to HS CTLs. (A) Cross-presentation experimental procedure. HLA-A2 donor cells were mock treated or infected with MVA-HIV (MOI = 1, 1 h), washed, seeded for 5 h to allow Gag expression, and cocultured with HLA-A2+ DCs for 1 h. DCs were then harvested and incubated for at least 8 h with HS T cells. (B) HS T-cell activation monitored by IFN-γ ELISPOT assay. As a positive control, HLA-A2+ DCs were directly infected with MVA-HIV (MOI = 1) or loaded with the SL9 peptide (1 μg/ml). Importantly, in the absence of DCs, HLA-A2 donor cells infected with MVA-HIV (MOI = 1) cannot stimulate HS CTLs. Mock-treated or MVA-infected donor cell-to-DC ratios are indicated (donor cell/DC). Background IFN-γ production induced by uninfected cells and IFN-γ production by target cells alone (at least three times lower than that with HS CTLs) were subtracted. For each panel, data are means ± SD for duplicates or triplicates and are representative of 3 independent experiments.
FIG. 6.
FIG. 6.
Exposure to MVA-HIV inhibits HIV replication in DC and DC-T-cell cocultures. (A) Impact of MVA-HIV on HIV replication in DCs. DCs were mock treated or incubated with MVA-HIV (1 h, MOI = 1), washed, and loaded with HIVNL-AD8 (2 h, high and low doses of 100 and 1 ng of HIV Gag p24/ml/106 cells, respectively), and HIV replication was monitored. (B) Kinetics of HIV replication in DC culture supernatants, assessed by HIV Gag p24 ELISA. (C) Impact of MVA-HIV on HIV transfer. DCs were treated as in panel A (HIVNL-AD8, 2 h, 1 ng of HIV Gag p24/ml/106 cells) and cocultured with activated autologous CD4+ T cells (1 DC/1 T cell). (D) Kinetics of HIV replication in DC-T-cell culture supernatants, assessed by HIV Gag p24 ELISA. As controls, DCs were cultured separately (DC alone) and CD4+ T cells were directly infected with the same HIV dose (T alone), and HIV replication was monitored. For each panel, data are means ± SD for duplicates and are representative of at least 3 independent experiments. d, day.
FIG. 7.
FIG. 7.
Exposure to MVA-HIV-infected cells inhibits HIV replication in DCs and DC-T-cell cocultures. (A) Impact of MVA-HIV-infected cells on HIV replication in DCs. HeLa cells were infected with MVA-HIV (1 h, MOI = 1) (HeLa-MVA) or mock infected (HeLa), washed extensively, seeded (5 h) to allow MVA-HIV infection, and cocultured with DCs (1 HeLa cell for 10 DCs). After overnight (ON) coincubation, DCs were harvested by gentle pipetting and infected with HIVNL-AD8 (2 h, high and low doses of 100 and 1 ng of HIV Gag p24/ml/106 cells, respectively), and HIV replication was monitored. (B) Kinetics of HIV replication in DC culture supernatants, assessed by HIV Gag p24 ELISA. Data are means ± SD for duplicates and are representative of 2 independent experiments. (C) Impact of MVA-HIV-infected cells on HIV transfer. HeLa cells or primary myotubes were infected with MVA-HIV or mock infected and were cocultured with DCs as described for panel A. After overnight coincubation, DCs were harvested, infected with HIVNL-AD8 (2 h, 1 ng of HIV Gag p24/ml/106 cells), washed, and cocultured with activated autologous CD4+ T cells (1 DC to 1 T cell) in 96-well plates at 2 × 10⁶ cells/ml. (D) Kinetics of HIV replication in DC-T-cell culture supernatants, assessed by HIV Gag p24 ELISA. As controls, DCs were cultured separately (DC) and CD4+ T cells were directly infected with the same HIV dose (T), and HIV replication was monitored. Data are means ± SD for duplicates and are representative of 3 independent experiments.
FIG. 8.
FIG. 8.
DCs infected with MVA-HIV or exposed to MVA-HIV-infected cells secrete IFN-α. DCs, HeLa cells, and myotubes were directly infected with MVA-HIV (1 h, MOI = 1), washed, and cultured for 20 h, and IFN-α release in the culture supernatants was monitored. Alternatively, HeLa cells or myotubes (2 × 10⁵ plated in 6-well plates) were infected with MVA-HIV (1 h, MOI = 1), washed extensively, seeded for 5 h to allow MVA-HIV internalization, and cocultured with DCs (2 × 10⁶). After overnight coculture, supernatants were assessed for IFN-α. As a positive control, DCs were incubated with 4 U of hemagglutinin of SeV (55). IFN-α was quantified using a bioassay (HL116 reporter cell line) and is expressed in IFN-α2a concentration equivalents. For each sample, a serial dilution was performed and submitted to the bioassay. Data for one dilution are presented and are representative of 3 (left) and 2 (right) independent experiments.

Similar articles

Cited by

References

    1. Amara, R. R., F. Villinger, S. I. Staprans, J. D. Altman, D. C. Montefiori, N. L. Kozyr, Y. Xu, L. S. Wyatt, P. L. Earl, J. G. Herndon, H. M. McClure, B. Moss, and H. L. Robinson. 2002. Different patterns of immune responses but similar control of a simian-human immunodeficiency virus 89.6P mucosal challenge by modified vaccinia virus Ankara (MVA) and DNA/MVA vaccines. J. Virol. 76:7625-7631. - PMC - PubMed
    1. Appay, V., P. R. Dunbar, M. Callan, P. Klenerman, G. M. Gillespie, L. Papagno, G. S. Ogg, A. King, F. Lechner, C. A. Spina, S. Little, D. V. Havlir, D. D. Richman, N. Gruener, G. Pape, A. Waters, P. Easterbrook, M. Salio, V. Cerundolo, A. J. McMichael, and S. L. Rowland-Jones. 2002. Memory CD8+ T cells vary in differentiation phenotype in different persistent virus infections. Nat. Med. 8:379-385. - PubMed
    1. Barouch, D. H. 2008. Challenges in the development of an HIV-1 vaccine. Nature 455:613-619. - PMC - PubMed
    1. Bevan, M. J. 2004. Helping the CD8(+) T-cell response. Nat. Rev. Immunol. 4:595-602. - PubMed
    1. Blanchard, T. J., A. Alcami, P. Andrea, and G. L. Smith. 1998. Modified vaccinia virus Ankara undergoes limited replication in human cells and lacks several immunomodulatory proteins: implications for use as a human vaccine. J. Gen. Virol. 79:1159-1167. - PubMed

Publication types