

Rewirable gene regulatory networks in the preimplantation embryonic development of three mammalian species
- PMID: 20219939
- PMCID: PMC2877577
- DOI: 10.1101/gr.100594.109
Rewirable gene regulatory networks in the preimplantation embryonic development of three mammalian species
Abstract
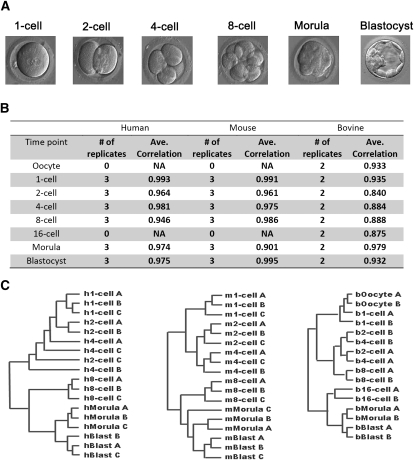
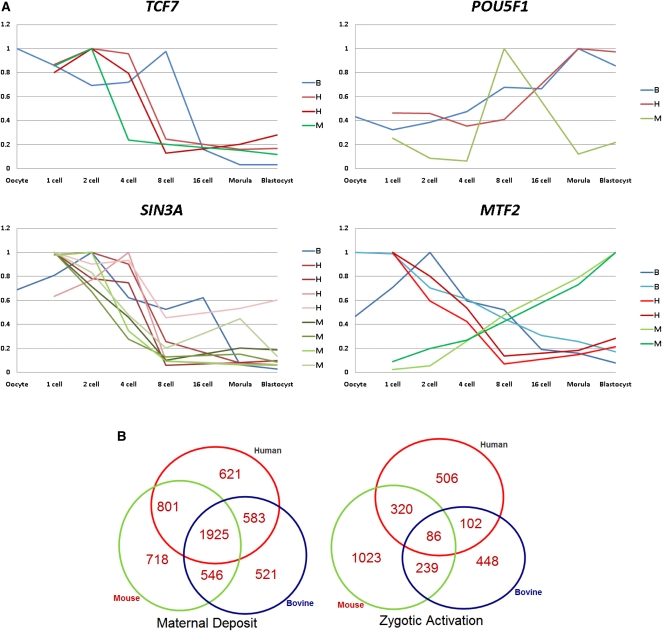
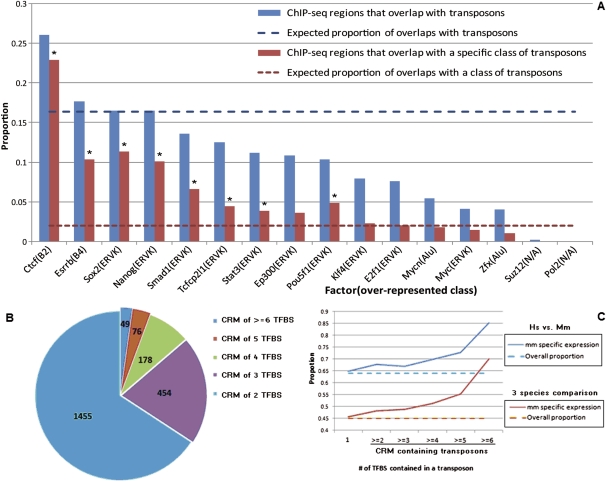
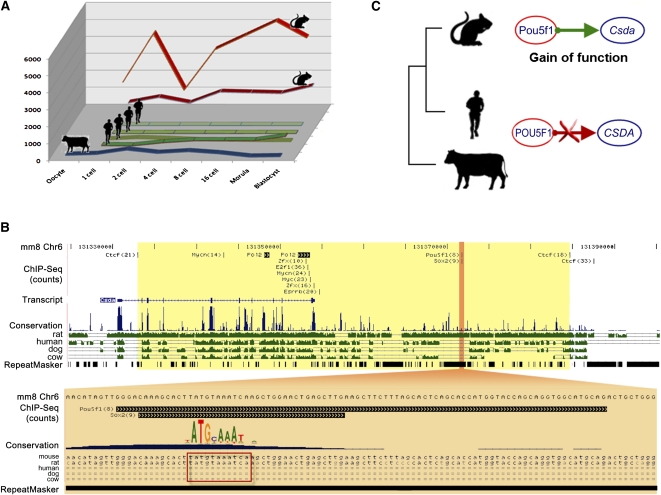
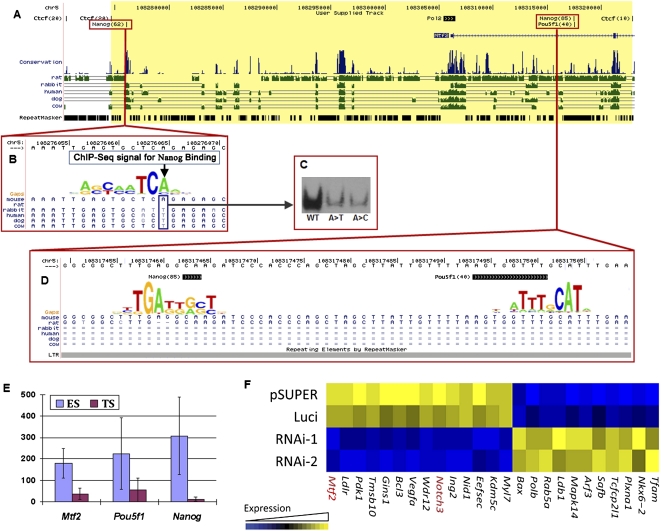
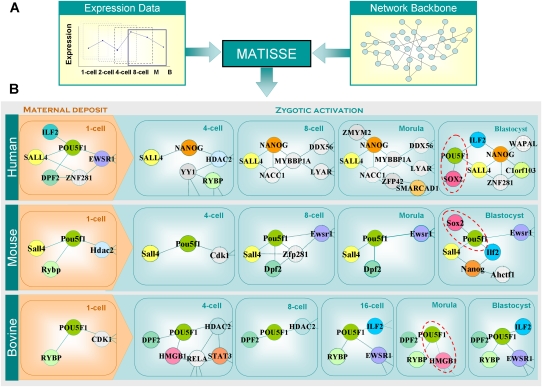
Mammalian preimplantation embryonic development (PED) is thought to be governed by highly conserved processes. While it had been suggested that some plasticity of conserved signaling networks exists among different mammalian species, it was not known to what extent modulation of the genomes and the regulatory proteins could "rewire" the gene regulatory networks (GRN) that control PED. We therefore generated global transcriptional profiles from three mammalian species (human, mouse, and bovine) at representative stages of PED, including: zygote, two-cell, four-cell, eight-cell, 16-cell, morula and blastocyst. Coexpression network analysis suggested that 40.2% orthologous gene triplets exhibited different expression patterns among these species. Combining the expression data with genomic sequences and the ChIP-seq data of 16 transcription regulators, we observed two classes of genomic changes that contributed to interspecies expression difference, including single nucleotide mutations leading to turnover of transcription factor binding sites, and insertion of cis-regulatory modules (CRMs) by transposons. About 10% of transposons are estimated to carry CRMs, which may drive species-specific gene expression. The two classes of genomic changes act in concert to drive mouse-specific expression of MTF2, which links POU5F1/NANOG to NOTCH signaling. We reconstructed the transition of the GRN structures as a function of time during PED. A comparison of the GRN transition processes among the three species suggested that in the bovine system, POU5F1's interacting partner SOX2 may be replaced by HMGB1 (a TF sharing the same DNA binding domain with SOX2), resulting in rewiring of GRN by a trans change.
Figures
Similar articles
-
Search for the bovine homolog of the murine ped gene and characterization of its messenger RNA expression during bovine preimplantation development.Biol Reprod. 2004 Feb;70(2):488-94. doi: 10.1095/biolreprod.103.022137. Epub 2003 Oct 20. Biol Reprod. 2004. PMID: 14568917
-
Bovine lineage specification revealed by single-cell gene expression analysis from zygote to blastocyst.Biol Reprod. 2017 Jul 1;97(1):5-17. doi: 10.1093/biolre/iox071. Biol Reprod. 2017. PMID: 28859285
-
Exploratory bioinformatics investigation reveals importance of "junk" DNA in early embryo development.BMC Genomics. 2017 Feb 23;18(1):200. doi: 10.1186/s12864-017-3566-0. BMC Genomics. 2017. PMID: 28231763 Free PMC article.
-
Predicting distinct organization of transcription factor binding sites on the promoter regions: a new genome-based approach to expand human embryonic stem cell regulatory network.Gene. 2013 Dec 1;531(2):212-9. doi: 10.1016/j.gene.2013.09.011. Epub 2013 Sep 13. Gene. 2013. PMID: 24042128
-
From blastocyst to gastrula: gene regulatory networks of embryonic stem cells and early mouse embryogenesis.Philos Trans R Soc Lond B Biol Sci. 2014 Dec 5;369(1657):20130542. doi: 10.1098/rstb.2013.0542. Philos Trans R Soc Lond B Biol Sci. 2014. PMID: 25349451 Free PMC article. Review.
Cited by
-
Constraint and opportunity in genome innovation.RNA Biol. 2014;11(3):186-96. doi: 10.4161/rna.27506. Epub 2013 Dec 20. RNA Biol. 2014. PMID: 24572460 Free PMC article. Review.
-
Clinical and Genetic Characteristics of Mitochondrial Encephalopathy Due to FOXRED1 Mutations: Two Chinese Case Reports and a Review of the Literature.Front Neurol. 2021 Feb 3;12:633397. doi: 10.3389/fneur.2021.633397. eCollection 2021. Front Neurol. 2021. PMID: 33613441 Free PMC article.
-
Amhr2-Cre-Mediated Global Tspo Knockout.J Endocr Soc. 2020 Jan 12;4(2):bvaa001. doi: 10.1210/jendso/bvaa001. eCollection 2020 Feb 1. J Endocr Soc. 2020. PMID: 32099945 Free PMC article.
-
Profiling the transcriptomic signatures and identifying the patterns of zygotic genome activation - a comparative analysis between early porcine embryos and their counterparts in other three mammalian species.BMC Genomics. 2022 Nov 24;23(1):772. doi: 10.1186/s12864-022-09015-4. BMC Genomics. 2022. PMID: 36434523 Free PMC article.
-
Cell differentiation events in pre-implantation mouse and bovine embryos.Anim Reprod. 2022 Jan 7;18(4):e20210054. doi: 10.1590/1984-3143-AR2021-0054. eCollection 2021. Anim Reprod. 2022. PMID: 35035540 Free PMC article. Review.
References
-
- Adjaye J, Herwig R, Brink TC, Herrmann D, Greber B, Sudheer S, Groth D, Carnwath JW, Lehrach H, Niemann H 2007. Conserved molecular portraits of bovine and human blastocysts as a consequence of the transition from maternal to embryonic control of gene expression. Physiol Genomics 31: 315–327 - PubMed
-
- Baugh LR, Hill AA, Brown EL, Hunter CP 2001. Quantitative analysis of mRNA amplification by in vitro transcription. Nucleic Acids Res 29: e29 http://nar.oxfordjournals.org/cgi/content/full/29/5/e29 - PMC - PubMed
-
- Braude P, Bolton V, Moore S 1988. Human gene expression first occurs between the four- and eight-cell stages of preimplantation development. Nature 332: 459–461 - PubMed
Publication types
MeSH terms
Substances
LinkOut - more resources
Full Text Sources
Molecular Biology Databases
Research Materials
Miscellaneous