

The (r)evolution of SINE versus LINE distributions in primate genomes: sex chromosomes are important
- PMID: 20219940
- PMCID: PMC2860162
- DOI: 10.1101/gr.099044.109
The (r)evolution of SINE versus LINE distributions in primate genomes: sex chromosomes are important
Abstract
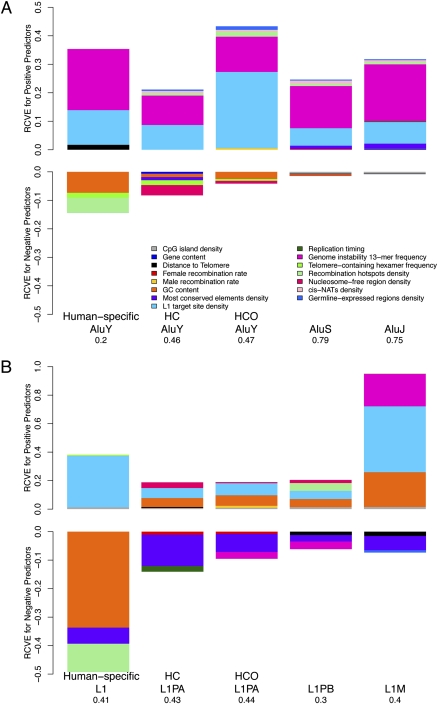
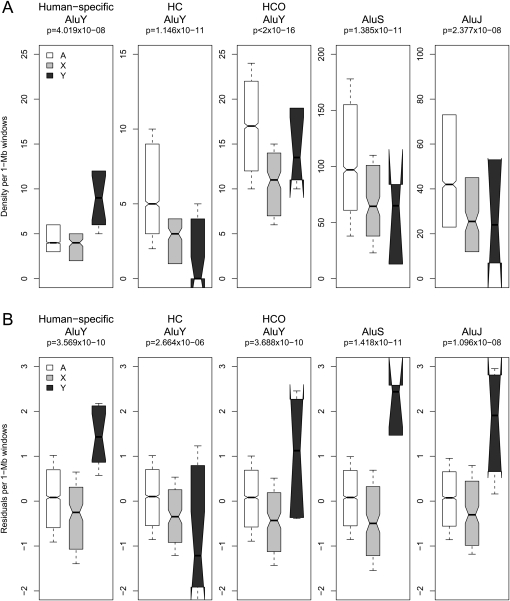
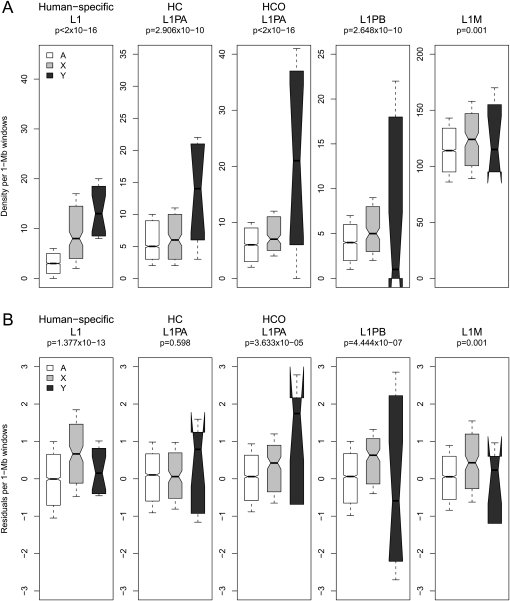
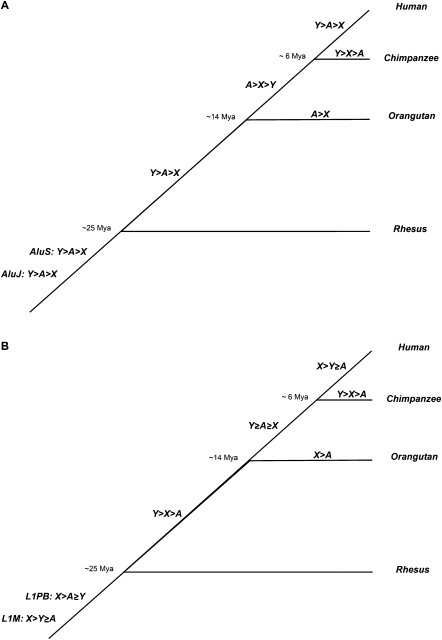
The densities of transposable elements (TEs) in the human genome display substantial variation both within individual chromosomes and among chromosome types (autosomes and the two sex chromosomes). Finding an explanation for this variability has been challenging, especially in light of genome landscapes unique to the sex chromosomes. Here, using a multiple regression framework, we investigate primate Alu and L1 densities shaped by regional genome features and location on a particular chromosome type. As a result of our analysis, first, we build statistical models explaining up to 79% and 44% of variation in Alu and L1 element density, respectively. Second, we analyze sex chromosome versus autosome TE densities corrected for regional genomic effects. We discover that sex-chromosome bias in Alu and L1 distributions not only persists after accounting for these effects, but even presents differences in patterns, confirming preferential Alu integration in the male germline, yet likely integration of L1s in both male and female germlines or in early embryogenesis. Additionally, our models reveal that local base composition (measured by GC content and density of L1 target sites) and natural selection (inferred via density of most conserved elements) are significant to predicting densities of L1s. Interestingly, measurements of local double-stranded breaks (a 13-mer associated with genome instability) strongly correlate with densities of Alu elements; little evidence was found for the role of recombination-driven deletion in driving TE distributions over evolutionary time. Thus, Alu and L1 densities have been influenced by the combination of distinct local genome landscapes and the unique evolutionary dynamics of sex chromosomes.
Figures
Similar articles
-
The distribution of L1 and Alu retroelements in relation to GC content on human sex chromosomes is consistent with the ectopic recombination model.J Mol Evol. 2006 Oct;63(4):484-92. doi: 10.1007/s00239-005-0275-0. Epub 2006 Sep 4. J Mol Evol. 2006. PMID: 16955238
-
Retroelement distributions in the human genome: variations associated with age and proximity to genes.Genome Res. 2002 Oct;12(10):1483-95. doi: 10.1101/gr.388902. Genome Res. 2002. PMID: 12368240 Free PMC article.
-
Characterization of pre-insertion loci of de novo L1 insertions.Gene. 2007 Apr 1;390(1-2):190-8. doi: 10.1016/j.gene.2006.08.024. Epub 2006 Sep 12. Gene. 2007. PMID: 17067767 Free PMC article.
-
Does SINE evolution preclude Alu function?Nucleic Acids Res. 1998 Oct 15;26(20):4541-50. doi: 10.1093/nar/26.20.4541. Nucleic Acids Res. 1998. PMID: 9753719 Free PMC article. Review.
-
Evolutionary history of 7SL RNA-derived SINEs in Supraprimates.Trends Genet. 2007 Apr;23(4):158-61. doi: 10.1016/j.tig.2007.02.002. Epub 2007 Feb 20. Trends Genet. 2007. PMID: 17307271 Review.
Cited by
-
Evolution and diversity of transposable elements in fish genomes.Sci Rep. 2019 Oct 28;9(1):15399. doi: 10.1038/s41598-019-51888-1. Sci Rep. 2019. PMID: 31659260 Free PMC article.
-
Similar Evolutionary Trajectories for Retrotransposon Accumulation in Mammals.Genome Biol Evol. 2017 Sep 1;9(9):2336-2353. doi: 10.1093/gbe/evx179. Genome Biol Evol. 2017. PMID: 28945883 Free PMC article.
-
Mapping Retrotransposon LINE-1 Sequences into Two Cebidae Species and Homo sapiens Genomes and a Short Review on Primates.Genes (Basel). 2022 Sep 27;13(10):1742. doi: 10.3390/genes13101742. Genes (Basel). 2022. PMID: 36292627 Free PMC article.
-
Differential chromosomal organization between Saguinus midas and Saguinus bicolor with accumulation of differences the repetitive sequence DNA.Genetica. 2017 Oct;145(4-5):359-369. doi: 10.1007/s10709-017-9971-0. Epub 2017 Jun 20. Genetica. 2017. PMID: 28634866
-
Transposable elements in mammalian chromatin organization.Nat Rev Genet. 2023 Oct;24(10):712-723. doi: 10.1038/s41576-023-00609-6. Epub 2023 Jun 7. Nat Rev Genet. 2023. PMID: 37286742 Review.
References
-
- Abrusan G, Krambeck H-J 2006. The distribution of L1 and Alu retroelements in relation to GC content on human sex chromosomes is consistent with the ectopic recombination model. J Mol Evol 63: 484–492 - PubMed
-
- Batzer MA, Deininger PL 2002. Alu repeats and human genomic diversity. Nat Rev Genet 3: 370–380 - PubMed
-
- Belle EMS, Webster MT, Eyre-Walker A 2005. Why are young and old repetitive elements distributed differently in the human genome? J Mol Evol 60: 290–296 - PubMed
Publication types
MeSH terms
Grants and funding
LinkOut - more resources
Full Text Sources
Research Materials
Miscellaneous