. 2010 Apr;20(4):440-6.
doi: 10.1101/gr.103606.109. Epub 2010 Mar 10.

Age-dependent DNA methylation of genes that are suppressed in stem cells is a hallmark of cancer

Affiliations

Age-dependent DNA methylation of genes that are suppressed in stem cells is a hallmark of cancer

Andrew E Teschendorff et al. Genome Res. 2010 Apr.

Abstract

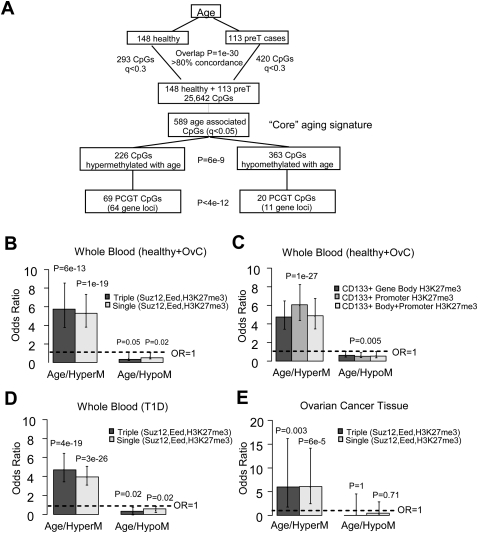
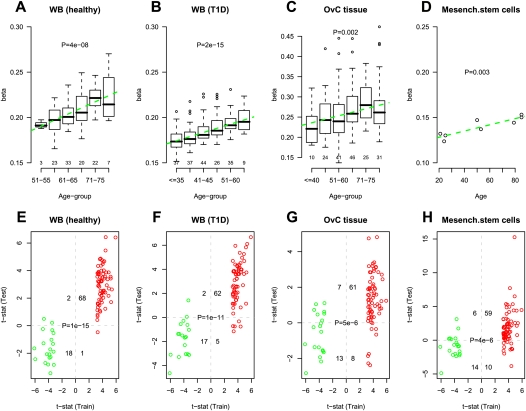
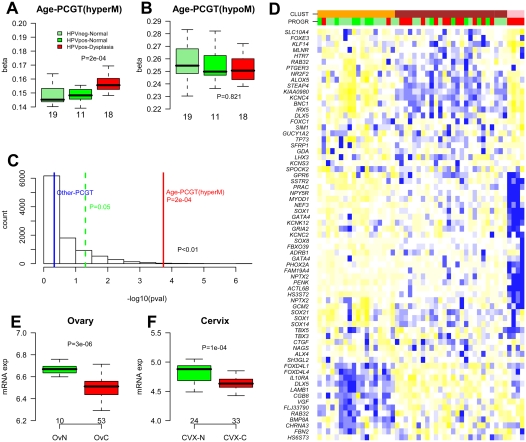
Polycomb group proteins (PCGs) are involved in repression of genes that are required for stem cell differentiation. Recently, it was shown that promoters of PCG target genes (PCGTs) are 12-fold more likely to be methylated in cancer than non-PCGTs. Age is the most important demographic risk factor for cancer, and we hypothesized that its carcinogenic potential may be referred by irreversibly stabilizing stem cell features. To test this, we analyzed the methylation status of over 27,000 CpGs mapping to promoters of approximately 14,000 genes in whole blood samples from 261 postmenopausal women. We demonstrate that stem cell PCGTs are far more likely to become methylated with age than non-targets (odds ratio = 5.3 [3.8-7.4], P < 10(-10)), independently of sex, tissue type, disease state, and methylation platform. We identified a specific subset of 69 PCGT CpGs that undergo hypermethylation with age and validated this methylation signature in seven independent data sets encompassing over 900 samples, including normal and cancer solid tissues and a population of bone marrow mesenchymal stem/stromal cells (P < 10(-5)). We find that the age-PCGT methylation signature is present in preneoplastic conditions and may drive gene expression changes associated with carcinogenesis. These findings shed substantial novel insights into the epigenetic effects of aging and support the view that age may predispose to malignant transformation by irreversibly stabilizing stem cell features.


Figures

Figure 1.
Figure 1.
DNAm signatures for aging and enrichment of PCGTs. (A) Flowchart depicting the derivation of the “core” DNA methylation signature for aging. First, the supervised analysis was performed separately for the blood samples from 148 healthy and 113 ovarian cancer cases. This yielded 293 CpGs and 420 CpGs passing a FDR (q) cut-off of 0.3. There was a strong overlap between these two signatures (Fisher's exact test, P = 10−30) with >80% concordance. Healthy and pretreatment samples were thus combined and supervised analysis was performed on this larger set to identify with more confidence a DNA methylation signature for aging. This gave 589 age-associated CpGs (q < 0.05), termed the “core” aging signature. Distribution of these 589 CpGs in terms of hyper- and hypomethylation patterns demonstrated a skew toward hypomethylation (binomial test, P = 6 × 10⁻⁹). Among the 226 hypermethylated CpGs, 69 mapped to polycomb group targets (PCGTs) (64 unique gene loci), while among the 363 hypomethylated CpGs this number was only 20 (11 unique gene loci). Thus, relative to the “core” aging signature, PCGTs were preferentially hypermethylated (69 vs. 20 compared with 226 vs. 363, Fisher's exact test, P < 4 × 10⁻¹²). Here, PCGTs were defined by promoter occupancy of any one of SUZ12, EED, or H3K27me3 in human embryonic stem cells (Lee et al. 2006). (B,C) Enrichment odds ratios with 95% confidence intervals for PCGTs (B) and for H3K27me3 marks (C), among the 226 age-hypermethylated and 363 age-hypomethylated CpGs. H3K27me3 marks were defined by trimethylation of H3K27 within gene body, promoter, and gene body + promoter regions in CD133+ hematopoietic stem cells (HSC) (Cui et al. 2009). (D,E) Independent validation: enrichment odds ratios with 95% confidence intervals for PCGTs among CpGs undergoing significant hyper- and hypomethylation with age in 188 blood samples from patients with type-1 diabetes (D) and 177 ovarian cancer samples (E). (Dashed line) Line of unit odds ratio. Two-tailed P-values of enrichment (i.e., deviation from this line) are given.
Figure 2.
Figure 2.
External validation of specific age-associated PCGT DNAm signature. (AD) Average beta-methylation values over the 69 age-hypermethylated PCGTs (y-axis) as a function of age (x-axis) in validation data sets. Number of samples in each age group are given above the x-axis. t-test P-values for linear trend derived from a robust linear regression are given; (green dashed line) best linear fit. (EH) Validation of age-associated (69 hypermethylated and 20 hypomethylated) PCGT CpGs in test sets. (X-axis) t-statistic of the linear regression test of age vs. methylation in the training set (blood samples from 148 healthy + 113 pretreatment ovarian cancer cases). Colors reflect directionality: (red) hypermethylated, (green) hypomethylated. (Y-axis) t-statistic of the linear regression test of age vs. methylation in the test set. We provide the number of CpGs displaying significant hyper/hypomethylation in the training set and hyper/hypomethylation in the test set, as well as the corresponding Fisher's exact test P-value. (A,E) Test set of blood samples from an independent set of 108 healthy individuals spanning an age range of 50–80 yr. In A, age was categorized into six age groups (50–55, 56–60, 61–65, 66–70, 71–75, >75). (B,F) Test set of blood samples from 188 T1D patients spanning an age range of 24–74 yr. In B, age was categorized into six age groups (≤35, 36–40, 41–45, 46–50, 51–60, >60). (C,G) A test set of ovarian cancer samples from 177 ovarian cancer patients spanning an age range 24–88 yr. In C, age was categorized into six age groups (≤40, 41–50, 51–60, 61–70, 71–75, >75). (D,H) A test set of eight bone marrow mesenchymal stromal cell samples from healthy donors of the following ages: 21, 24, 25, 50, 53, 79, 85, 85 (Bork et al. 2010).
Figure 3.
Figure 3.
Biological and clinical significance of age-PCGT DNAm signature. (A,B) Average methylation values of the 69 age-hypermethylated and 20 age-hypomethylated PCGT CpGs as a function of disease status in 48 cervical cytology samples. (HPVneg) Normal cervical sample not infected with HPV, (HPVpos) normal cervical sample infected with HPV, (HPVpos-Dysplasia) samples infected with HPV and displaying dysplasia. Wilcoxon test P-value between normal and dysplastic condition is given. Number of samples in each group given below boxplots. (C) Histogram distribution of −log10(P-values) from 1000 randomly selected 69 non-age-associated PCGT CpGs. P-values were derived from the Wilcoxon test. (Red line) −log10(P-value) for the 69 age-hypermethylated PCGT CpGs, (blue line) −log10(P-value) for PCGT CpGs not mapping to age-PCGTs. In less than 0.5% of runs (P < 0.01) were P-values as extreme as the observed one, indicating that the age-PCGTs discriminate the dysplastic condition better than a random set of PCGTs. (D) Heatmap of the 48 cervival samples over the 69 age-hypermethylated PCGT CpGs. Samples were clustered using a Gaussian mixture model and three optimal clusters were inferred using the Bayesian Information Criterion (see Supplemental material). (Orange, brown, pink) Distinct clusters. The disease status of samples is labeled as a color bar (PROGR): (light green) HPVneg, (green) HPVpos+normal, (red) HPVpos+dysplasia. CpGs were clustered according to hierarchical clustering with a Pearson correlation metric. Prior to sample and CpG clustering, methylation profiles of invividual CpGs were renormalized to mean zero and unit standard deviation. Heatmap reflects, for each CpG, relative methylation levels across samples as determined by the renormalized methylation profile. (Blue) Relative high methylation, (yellow) relative low methylation. (E,F) Average gene expression intensity (Affymetrix) values for the 64 age-hypermethylated PCGTs in normal ovarian (OvN) and ovarian cancer tissue (OvC) and in normal cervix (CVX-N) and cervical cancer (CVX-T). Number of samples of each type and Wilcoxon test P-values are given.

Similar articles

Cited by

References

    1. Ahuja N, Li Q, Mohan AL, Baylin SB, Issa JP. Aging and DNA methylation in colorectal mucosa and cancer. Cancer Res. 1998;58:5489–5494. - PubMed
    1. Baylin SB, Ohm JE. Epigenetic gene silencing in cancer—a mechanism for early oncogenic pathway addiction? Nat Rev Cancer. 2006;6:107–116. - PubMed
    1. Ben-Porath I, Thomson MW, Carey VJ, Ge R, Bell GW, Regev A, Weinberg RA. An embryonic stem cell-like gene expression signature in poorly differentiated aggressive human tumors. Nat Genet. 2008;40:499–507. - PMC - PubMed
    1. Bibikova M, Lin Z, Zhou L, Chudin E, Garcia EW, Wu B, Doucet D, Thomas NJ, Wang Y, Vollmer E, et al. High-throughput DNA methylation profiling using universal bead arrays. Genome Res. 2006;16:383–393. - PMC - PubMed
    1. Bjornsson HT, Sigurdsson MI, Fallin MD, Irizarry RA, Aspelund T, Cui H, Yu W, Rongione MA, Ekstroem TJ, Harris TB, et al. Intra-individual change over time in DNA methylation with familial clustering. JAMA. 2008;299:2877–2883. - PMC - PubMed

Publication types

MeSH terms

Substances