. 2010 Apr;20(4):434-9.
doi: 10.1101/gr.103101.109. Epub 2010 Mar 10.

Human aging-associated DNA hypermethylation occurs preferentially at bivalent chromatin domains

Affiliations

Human aging-associated DNA hypermethylation occurs preferentially at bivalent chromatin domains

Vardhman K Rakyan et al. Genome Res. 2010 Apr.

Abstract

There is a growing realization that some aging-associated phenotypes/diseases have an epigenetic basis. Here, we report the first genome-scale study of epigenomic dynamics during normal human aging. We identify aging-associated differentially methylated regions (aDMRs) in whole blood in a discovery cohort, and then replicate these aDMRs in sorted CD4(+) T-cells and CD14(+) monocytes in an independent cohort, suggesting that aDMRs occur in precursor haematopoietic cells. Further replication of the aDMRs in buccal cells, representing a tissue that originates from a different germ layer compared with blood, demonstrates that the aDMR signature is a multitissue phenomenon. Moreover, we demonstrate that aging-associated DNA hypermethylation occurs predominantly at bivalent chromatin domain promoters. This same category of promoters, associated with key developmental genes, is frequently hypermethylated in cancers and in vitro cell culture, pointing to a novel mechanistic link between aberrant hypermethylation in cancer, aging, and cell culture.


Figures

Figure 1.
Figure 1.
Aging-associated differentially methylated regions (aDMRs) found in human whole blood. (A) Methylation values (Beta scores from the Illumina Beadstudio software) are plotted as a function of age for 93 whole-blood samples, and 25 CD14+ monocyte and CD4+ T-cell samples. The whole-blood samples were collected from separate individuals than the sorted cells, and thus provide independent cross-validation. Trend lines show a least-squares fit to the whole-blood data set. Shown are four representative examples. A complete list of aDMRs is presented in Supplemental Table 3. (B) CpGs neighboring the aDMR CpG show similar age-related DNA methylation dynamics. For each CpG in the confirmed aDMR sets, we located the nearest neighbor (in terms of genomic location) represented on the array, and calculated the mean aging/methylation correlation of the two sets of neighbor CpGs. Box-and-whisker plots represent 50% and 95% credible intervals on the mean (bootstrapped).
Figure 2.
Figure 2.
Validation of whole-blood aDMRs in CD14+ monocytes and CD4+ T-cells from an independent cohort. For each probe with a significant aging-methylation correlation in the whole-blood data (P < 0.01), we calculated Spearman's ρ values from the CD4+ and CD14+ data sets. We plot 50% and 95% credible intervals for the box-and-whisker plots on bootstrap estimates of the mean for each data set.
Figure 3.
Figure 3.
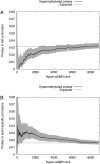
Hyper-aDMRs are not associated with housekeeping genes, but are enriched for neural-specific genes. (A) Probes were classified as “housekeeping” (HK) (lying within 2.5 kb of the TSS of a housekeeping gene according to Eisenberg and Levanon 2003) or otherwise. All probes with a positive methylation/age correlation were ranked in order of increasing P-value (i.e., decreasing probability of being a bona fide aDMR). For successively larger sets of probes from the top of the ranked list, we calculated the fraction of probes contained in the housekeeping set. (B) We subdivided CpG sites and indentified a brain-specific subset (lying within 2.5 kb of the TSS of a nervous system gene according to Dorus et al. 2004). Subsequent analysis is as for A. The filled regions indicate 95% credible intervals estimated from a Beta model.
Figure 4.
Figure 4.
Hyper-aDMRs are enriched for inactive histone modifications in CD4+ T-cells and bivalent chromatin domains in embryonic/haematopoietic stem cells. We collected the maximum tag-count within 200 bp of each CpG site on the Illumina27K array for a range of published ChIP-seq data sets (Barski et al. 2007; Zhao et al. 2007; Cui et al. 2009) (A) The ratios are plotted of mean tag count in CD4+ T-cells across the hyper-aDMR set, to mean tag count across the data set as a whole. Boxes represent 50% credible intervals on our estimate of the ratio, and whiskers represent 95% credible intervals (bootstrapped). Box-and-whisker plots above “1” represent significant enrichment, whereas below “1” represents significant depletion relative to the genome average. A figure showing correlations with all the ChIP-seq data reported in Barski et al. (2007) is shown in Supplemental Figure 1. (B) As in A, but analysis of hyper-aDMR promoters in human embryonic and haematopoietic stem cells.
Figure 5.
Figure 5.
Hyper-aDMRs are also hypermethylated in human leukaemia. We identified subsets of CpG sites as overlapping promoters (TSS ± 2.5 kb) of genes associated with leukemia according to Figueroa et al. (2009). For each of the two disease types, we calculated the enrichment of hyper-aDMRs amongst disease-associated CpGs relative to a model whereby aDMRs and disease genes occur independently. Boxes indicate 50% credible intervals on our estimate of this ratio, and whiskers indicate 95% intervals (Beta model).
Figure 6.
Figure 6.
Hyper-aDMRs replicate in buccal cells. For each probe with a significant positive aging-methylation correlation in the whole-blood data (P < 0.01), we calculated Spearman's ρ-values from the buccal data set. We split these into reproduced (correlation in the same direction in the CD4+ and CD14+ data sets) and nonreproduced data sets, and also show results for the complete set. We plot 50% and 95% credible intervals for the box-and-whisker plots on bootstrap estimates of the mean for each data set.

Similar articles

Cited by

References

    1. Azuara V, Perry P, Sauer S, Spivakov M, Jørgensen HF, John RM, Gouti M, Casanova M, Warnes G, Merkenschlager M, et al. Chromatin signatures of pluripotent cell lines. Nat Cell Biol. 2006;8:532–538. - PubMed
    1. Barski A, Cuddapah S, Cui K, Roh TY, Schones DE, Wang Z, Wei G, Chepelev I, Zhao K. High-resolution profiling of histone methylations in the human genome. Cell. 2007;129:823–837. - PubMed
    1. Bernstein BE, Mikkelsen TS, Xie X, Kamal M, Huebert DJ, Cuff J, Fry B, Meissner A, Wernig M, Plath K, et al. A bivalent chromatin structure marks key developmental genes in embryonic stem cells. Cell. 2006;125:315–326. - PubMed
    1. Bibikova M, Le J, Barnes R, Saedinia-Melnyk S, Zhou L, Shen R, Gunderson KL. Genome-wide DNA methylation profiling using Infinium® assay. Epigenomics. 2009;1:177–200. - PubMed
    1. Bjornsson HT, Sigurdsson MI, Fallin MD, Irizarry RA, Aspelund T, Cui H, Yu W, Rongione MA, Ekström TJ, Harris TB, et al. Intra-individual change over time in DNA methylation with familial clustering. JAMA. 2008;299:2877–2883. - PMC - PubMed

Publication types

MeSH terms