. 2010 Jun;298(6):C1401-13.
doi: 10.1152/ajpcell.00518.2009. Epub 2010 Mar 10.

Amino acid sensing by enteroendocrine STC-1 cells: role of the Na+-coupled neutral amino acid transporter 2

Affiliations

Amino acid sensing by enteroendocrine STC-1 cells: role of the Na+-coupled neutral amino acid transporter 2

Steven H Young et al. Am J Physiol Cell Physiol. 2010 Jun.

Abstract

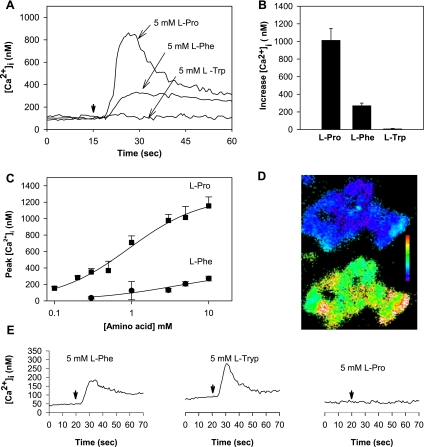
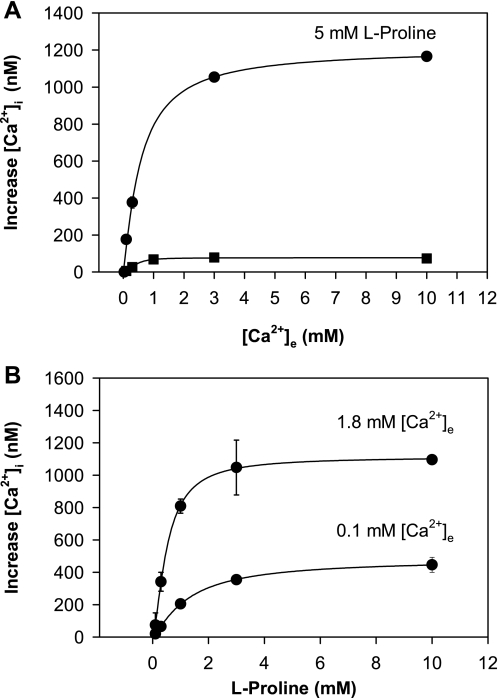
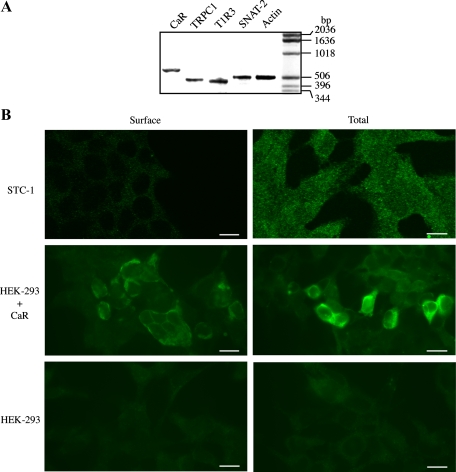
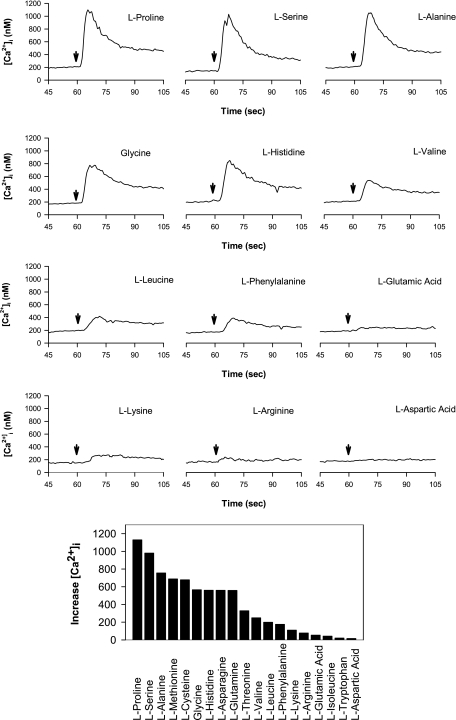
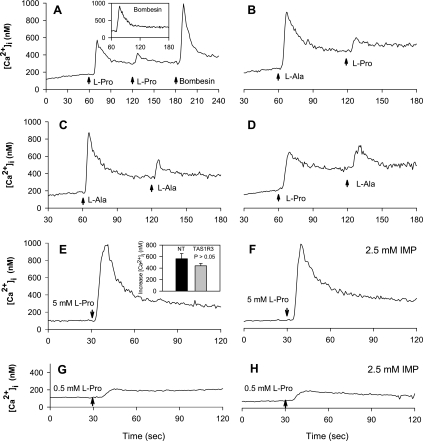
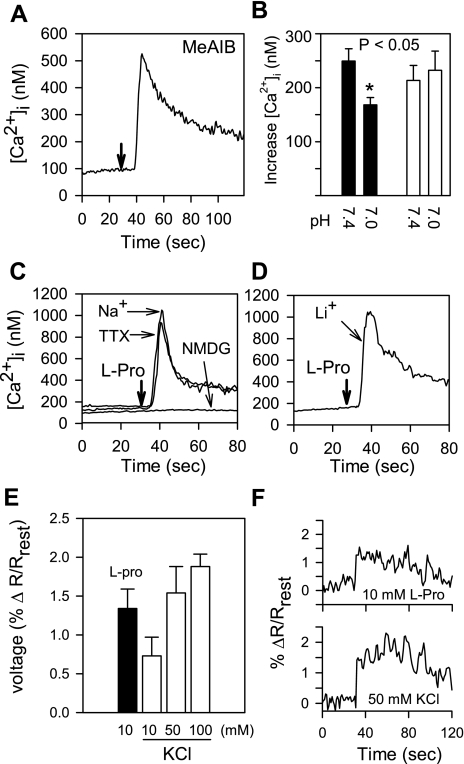
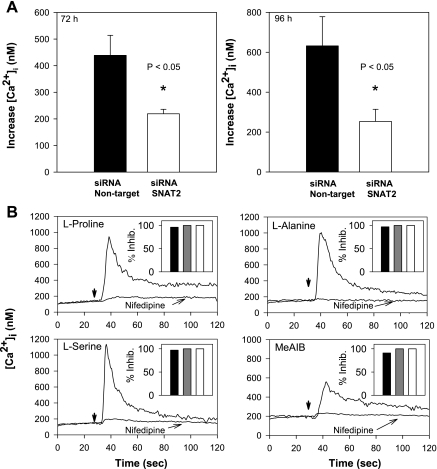
The results presented here show that STC-1 cells, a model of intestinal endocrine cells, respond to a broad range of amino acids, including l-proline, l-serine, l-alanine, l-methionine, l-glycine, l-histidine, and alpha-methyl-amino-isobutyric acid (MeAIB) with a rapid increase in the intracellular Ca(2+) concentration ([Ca(2+)](i)). We sought to identify the mechanism by which amino acids induce Ca(2+) signaling in these cells. Several lines of evidence suggest that amino acid transport through the Na(+)-coupled neutral amino acid transporter 2 (SNAT2) is a major mechanism by which amino acids induced Ca(2+) signaling in STC-1 cells: 1) the amino acid efficacy profile for inducing Ca(2+) signaling in STC-1 cells closely matches the amino acid specificity of SNAT2; 2) amino acid-induced Ca(2+) signaling in STC-1 cells was suppressed by removing Na(+) from the medium; 3) the nonmetabolized synthetic substrate of amino acid transport MeAIB produced a marked increase in [Ca(2+)](i); 4) transfection of small interfering RNA targeting SNAT2 produced a marked decrease in Ca(2+) signaling in response to l-proline in STC-1 cells; 5) amino acid-induced increase in [Ca(2+)](i) was associated with membrane depolarization and mediated by Ca(2+) influx, since it depended on extracellular Ca(2+); 6) the increase in [Ca(2+)](i) in response to l-proline, l-alanine, or MeAIB was abrogated by either nifedipine (1-10 muM) or nitrendipine (1 muM), which block L-type voltage-sensitive Ca(2+) channels. We hypothesize that the inward current of Na(+) associated with the function of SNAT2 leads to membrane depolarization and activation of voltage-sensitive Ca(2+) channels that mediate Ca(2+) influx, thereby leading to an increase in the [Ca(2+)](i) in enteroendocrine STC-1 cells.


Figures

Fig. 1.
Fig. 1.
A: addition of l-proline (Pro) or l-phenylalanine (Phe) induced an increase in intracellular Ca2+ concentration ([Ca2+]i) in STC-1 cells. Three separate experiments with l-proline, l-phenylalanine, or l-tryptophan (Trp) are overlaid. At the time marked by the downward pointing arrow, amino acid is injected into the cuvette (final concentration 5 mM, injection time + mixing time < 3 s). The concentration of Ca2+ in HBSS was 1.8 mM. B: increase in [Ca2+]i (defined as the difference between the peak [Ca2+]i of the transient response and the baseline value) after addition of l-proline (n = 13), l-phenylalanine (n = 4), or l-tryptophan (n = 5). C: dose-response curves of peak [Ca2+]i as a function of l-proline or l-phenylalanine concentration in STC-1 cells incubated in HBSS containing 1.8 mM Ca2+. D: single-cell imaging shows the majority of STC-1 cells respond to 5 mM l-proline. Top: cluster of 20–30 STC-1 cells at rest. Cells are pseudocolored to show varying levels of [Ca2+]i. Scale bar shows colors change from blue to green to red to white with increasing [Ca2+]i. Bottom: 30 s after addition of 5 mM l-proline to the HBSS bathing the cells. Virtually all cells showed increased [Ca2+]i. E: response of human embryonic kidney (HEK)-293 cells expressing human Ca2+-sensing receptor (CaR) to the same amino acids (i.e., l-proline, l-phenylalanine, or l-tryptophan), as applied to the STC-1 cells in A. Amino acids were added to the cuvette at the times marked by the downward arrow.
Fig. 2.
Fig. 2.
A: effect of extracellular Ca2+ concentration ([Ca2+]e) on increase of [Ca2+]i in STC-1 cells in the absence or in the presence of l-proline. Each data point represents a separate assay, where the cells were placed into a cuvette in Ca2+-free HBSS, and then Ca2+ was added to reach the final concentration shown in the abscissa. Increase in [Ca2+]i is plotted against final [Ca2+]e. Top trace was obtained from 2 experiments, where Ca2+-containing solution was added in the presence of 5 mM l-proline. The bottom trace, also from 2 experiments, was in the absence of l-proline. B: effect of increasing concentrations of l-proline on [Ca2+]i in the presence of [Ca2+]e at either 0.1 or 1.8 mM. The top trace is derived from 2 separate experiments with [Ca2+]e of 1.8 mM. The bottom curve is derived from 3 separate experiments with [Ca2+]e at 0.1 mM.
Fig. 3.
Fig. 3.
A: expression of CaR, transient receptor potential canonical 1 (TRPC1), T1R3 (taste receptor), and Na+-coupled neutral amino acid transporter 2 (SNAT2) in STC-1 cells. RT-PCR was performed using specific primers for each of the mRNAs encoding CaR, TRPC1, T1R3, SNAT2, and actin (see materials and methods) on 5 μg of total RNA isolated from STC-1 cells. PCR products were resolved on 2% agarose, and the gel was then stained with ethidium bromide. Products of the predicted size for the CaR (627 bp), TRPC1 (462 bp), T1R3 (423 bp), SNAT2 (506 bp), and actin (502 bp) were detected only when both antisense (A) and sense (S) primers were included during the second cDNA strand synthesis reactions. The results are representative of two independent experiments. B: intracellular distribution of the CaR in STC-1 cells. Fixed STC-1 cells, either permeabilized (total) or not (surface) using 0.3% Triton X-100, were incubated with an antibody that recognizes the NH2-terminus of the CaR extracellular domain. After extensive washes, the samples were incubated with Alexa Fluor 488-conjugated anti-rabbit and examined with a confocal microscope, as described under materials and methods. As controls, HEK-293 cells transfected (HEK-293 + CaR) or not (HEK-293) with a plasmid encoding the CaR were prepared for immunocytochemistry, as described for STC-1 cells, to detect total and surface CaR expression. The selected cells displayed in the figure were representative of 90% of the population of positive cells. Scale bars, 10 μm.
Fig. 4.
Fig. 4.
Top: effect of addition of different l-amino acids on [Ca2+]i in STC-1 cells. Time of addition is marked by downward arrow. In each case, the final amino acid concentration was 5 mM, and the [Ca2+]e was 1.8 mM. Bottom: average increase in [Ca2+]i in response to 19 different amino acids, each at 5 mM. Responses from 2 separate slides for each amino acid were averaged together.
Fig. 5.
Fig. 5.
AD: amino acids inhibit the increase in [Ca2+]i induced by the subsequent addition of the same or a different amino acid. The amino acids were added (time of addition marked by arrows) at 1 mM, and the [Ca2+]e was 1.8 mM. A: addition of 1 mM of l-proline inhibits the increase in [Ca2+]i induced by a second addition of 1 mM l-proline. In contrast, the Ca2+-mobilizing effect of 10 nM bombesin added to the culture after the second stimulation with l-proline was not impaired, indicating that the pools of intracellular Ca2+ were not depleted by consecutive exposure to l-proline. Inset shows the response to the addition of 10 nM bombesin in a parallel culture without prior exposure to amino acid. B, C, and D show that addition of 1 mM l-alanine inhibits the increase in [Ca2+]i produced by the subsequent addition of either l-proline (B) or l-alanine (C), and, similarly, that l-proline inhibits the increase in [Ca2+]i induced by subsequent addition of 1 mM l-alanine (D). E and F: the response of STC-1 cells to l-proline is not potentiated by previous exposure to 2.5 mM inosine 5′-monophosphate (IMP). E: response to 5 mM l-proline added to control solution. Inset: cells transfected with small interfering RNA (siRNA) targeting TAS1R3 did not change the response to l-proline. Cells were challenged with 5 mM l-proline 48 h after transfection with either siRNA targeting TAS1R3, or nontargeting (NT) siRNA. F: pretreatment of cells with HBSS containing 2.5 mM IMP (2 min) did not change the response to 5 mM l-proline. G and H: response to lower concentration (0.5 mM) of l-proline is similarly unaffected by prior exposure to 2.5 mM IMP.
Fig. 6.
Fig. 6.
A: STC-1 cells respond to 10 mM α-methyl-amino-isobutyric acid (MeAIB) with an increase in [Ca2+]i. In this and subsequent panels, injection times are marked by downward arrows. Resting external Ca2+ was 1.8 mM, pH 7.4. B: lowering pH from 7.4 to 7.0 reduces the response of STC-1 cells to MeAIB (solid bars), but did not alter Ca2+ signaling in response to bombesin (open bars). The addition of 10 mM MeAIB to STC-1 cells was followed after 120 s with 5 nM bombesin. C: the response of STC-1 cells to 5 mM l-proline required the presence of Na+ in the medium. When Na+ was substituted by NMDG, l-proline-induced Ca2+ signaling was abolished. The response to 5 mM l-proline in Na+-containing saline was not blocked by tetrodotoxin (TTX; 1 μM). D: STC-1 cells responded to l-proline when Na+ was replaced by Li+ in the medium. E: addition of 10 mM l-proline to STC-1 cells produces membrane depolarization, as indicated by the voltage-sensitive dye di-8-aminonaphthylethenylpyridinium (di-8-ANEPPS). Depolarization is measured as percent change (Δ) in the ratio of emissions at 560 nm and 620 nm (R) over resting levels (Rrest). Solid bar, l-proline; open bars, KCl at different concentrations. F: individual traces showing responses to 10 mM l-proline and 50 mM KCl.
Fig. 7.
Fig. 7.
A: transfection of STC-1 cells with siRNA targeting SNAT2 for either 72 h (left) or 96 h (right) significantly reduced Ca2+ signaling in response to 1 mM l-proline, compared with cells transfected with NT siRNA. B: responses of STC-1 cells to different amino acids (added at the times marked by the downward arrows) or MeAIB are blocked by the L-type voltage-sensitive Ca2+ channel blockers, either nifedipine or nitrendipine. Traces show responses in STC-1 cells incubated in the absence or in the presence of nifedipine at 1 μM. Nifedipine or nitrendipine was added to the cells 2–5 min before the addition of amino acids at 5 mM, or MeAIB at 10 mM. Two separate experiments are superimposed in each panel. For clarity, starting [Ca2+]i were translated to align. Insets show percent inhibition of the responses to nifedipine at 1 μM (solid bars), nifedipine at 10 μM (shaded bars), and nitrendipine at 1 μM (open bars).

Similar articles

Cited by

References

    1. Ballantyne G. Peptide YY(1–36) and peptide YY(3–36). I. Distribution, release and actions. Obes Surg 16: 651–658, 2006. - PubMed
    1. Beach JM, McGahren ED, Xia J, Duling BR. Ratiometric measurement of endothelial depolarization in arterioles with a potential-sensitive dye. Am J Physiol Heart Circ Physiol 270: H2216–H2227, 1996 - PubMed
    1. Brown EM, Gamba G, Riccardi D, Lombardi M, Butters R, Kifor O, Sun A, Hediger MA, Lytton J, Hebert SC. Cloning and characterization of an extracellular Ca(2+)-sensing receptor from bovine parathyroid. Nature 366: 575–580, 1993 - PubMed
    1. Buchan AMJ, Squires PE, Ring M, Meloche RM. Mechanism of action of the calcium-sensing receptor in human antral gastrin cells. Gastroenterology 120: 1128–1139, 2001 - PubMed
    1. Catterall WA, Striessnig J, Snutch TP, Perez-Reyes E. International Union of Pharmacology XL compendium of voltage-gated ion channels: calcium channels. Pharmacol Rev 55: 579–581, 2003 - PubMed

Publication types

MeSH terms

LinkOut - more resources