. 2010 May 1;21(9):1597-608.
doi: 10.1091/mbc.e09-12-1033. Epub 2010 Mar 10.

Src-dependent TrkA transactivation is required for pituitary adenylate cyclase-activating polypeptide 38-mediated Rit activation and neuronal differentiation

Affiliations

Src-dependent TrkA transactivation is required for pituitary adenylate cyclase-activating polypeptide 38-mediated Rit activation and neuronal differentiation

Geng-Xian Shi et al. Mol Biol Cell. .

Abstract

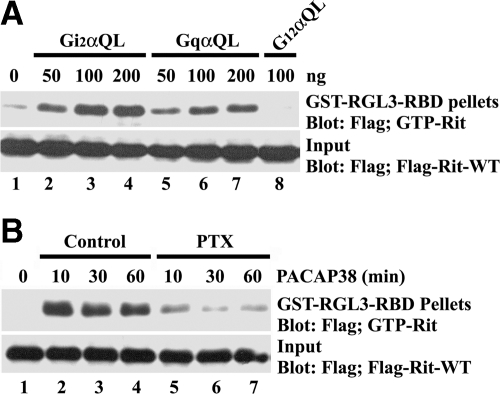
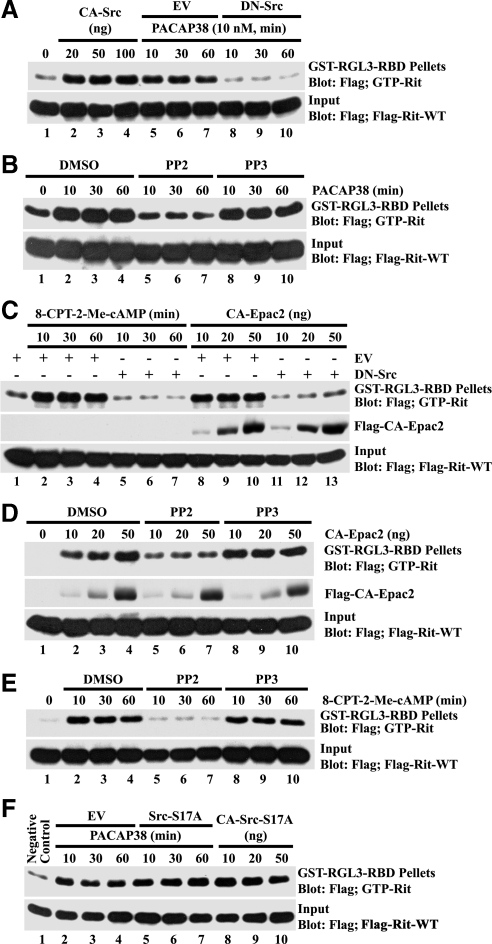
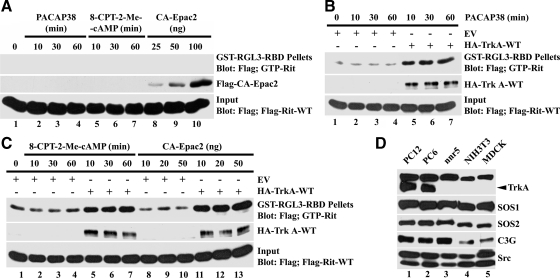
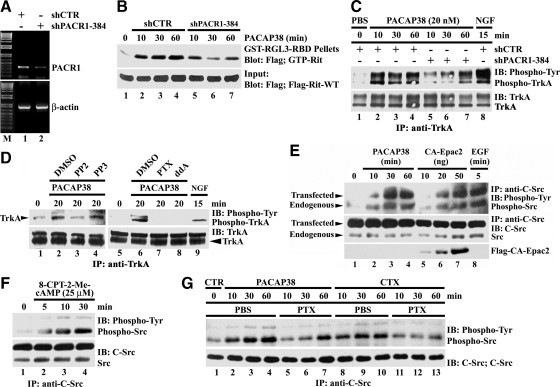
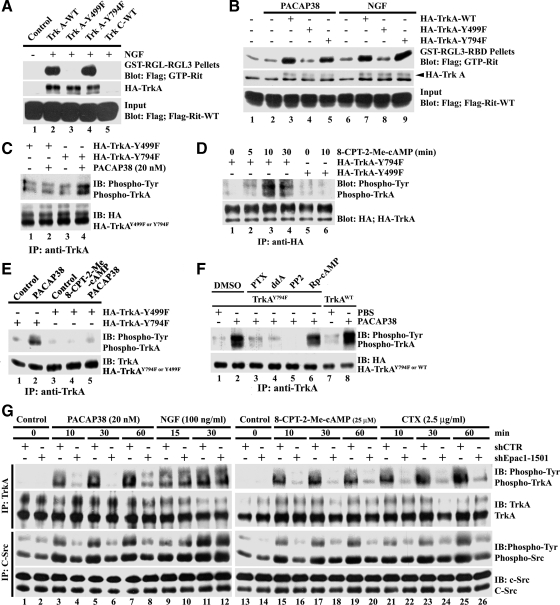
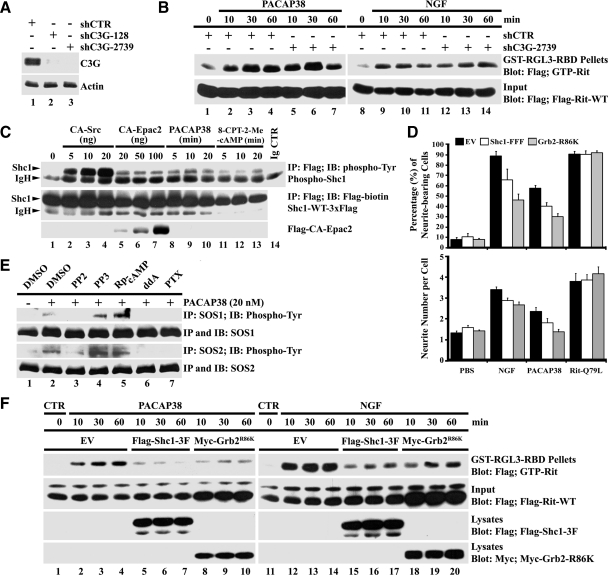
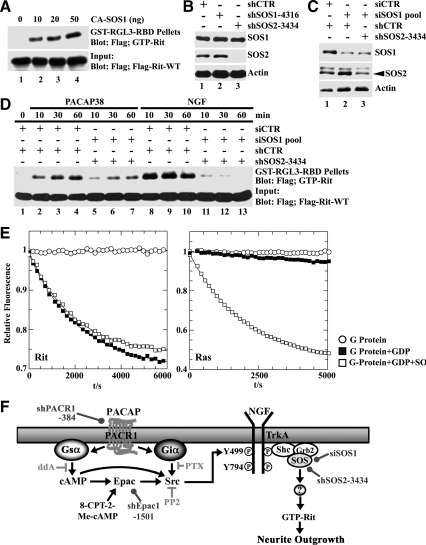
Pituitary adenylate cyclase-activating polypeptide (PACAP) is a potent neuropeptide that possesses both neurotrophic and neurodevelopmental effects. Recently, the Rit GTPase was found to be activated by a novel Galpha/cAMP/exchange protein activated by cyclic AMP (Epac)-dependent signaling pathway and required for PACAP-dependent cAMP response element-binding protein activation and neuronal differentiation. However, Epac did not function as a Rit guanine nucleotide exchange factor (GEF), and the nature of the PACAP regulatory cascade remained unclear. Here, we show that PACAP-mediated Rit activation involves Src family kinase-dependent TrkA receptor transactivation. PACAP receptor (PACR1) stimulation triggered both G(i)alpha and G(s)alpha/cAMP/Epac regulatory cascades resulting in Src kinase activity, which in turn induced TrkA kinase tyrosine phosphorylation. Importantly, Src inhibition, or the lack of functional Trk receptors, was found to inhibit PACAP-mediated Rit activation, whereas constitutively active Src alone was sufficient to stimulate Rit-guanosine triphosphate levels. A single tyrosine (Y(499)) phosphorylation event was identified as critical to both PACAP-mediated transactivation and TrkA-dependent Rit activation. Accordingly, PACAP stimulation resulted in TrkA-dependent phosphorylation of both the Shc adaptor and son of sevenless (SOS)1/2 GEFs, and Rit activation was inhibited by RNA interference silencing of SOS1/2, implicating a TrkA/Shc/SOS signaling complex in Rit regulation. Together, these observations expand upon the nature of PACR1-mediated transactivation and identify TrkA-Rit signaling as a key contributor to PACAP-dependent neuronal differentiation.


Figures

Figure 1.
Figure 1.
Giα and Gqα signaling activates Rit. (A) PC6 cells transiently cotransfected with 3xFLAG-Rit-WT and either Gi2αQ204L, GqαQ209L, or G12αQ229L, were serum starved (5 h) before the preparation of whole cell lysates. GTP-bound Rit levels were examined after GST-RGL3-RBD precipitation as described in Materials and Methods. (B) PC6 cells expressing 3xFLAG-Rit-WT were starved in serum-free DMEM for 5 h and subsequently pretreated with PTX (100 ng/ml for 30 min) or dimethyl sulfoxide before PACAP38 (10 nM) stimulation. Rit-GTP levels were assayed as described in A. The data are representative of the three individual experiments.
Figure 2.
Figure 2.
Src is required for PACAP38-cAMP-Epac-mediated Rit activation. (A) PC6 cells were transiently cotransfected with 3xFLAG-Rit-WT and CA-Src or DN-Src, allowed to recover for 36 h, serum starved for 5 h, and then stimulated with PACAP38 (10 nM). GTP-Rit levels were determined by GST-RGL3-RBD pull-down assay as described in Materials and Methods. (B) PC6 cells expressing FLAG-tagged Rit were serum starved for 5 h and pretreated with PP2 (10 μM), PP3 (10 μM), or dimethyl sulfoxide (DMSO) (vehicle) for 30 min before PACAP38 stimulation (10 nM). GTP-Rit levels were monitored by GST-RGL3-RBD pull-down. (C) PC6 cells were cotransfected with 3xFLAG-Rit-WT and DN-Src or empty vector in the presence or absence of CA-Epac2, or they were stimulated with 8-CPT-2-Me-cAMP (25 μM) as indicated. GTP-bound Rit levels were analyzed as described above. (D) PC6 cells were coexpressed with 3xFLAG-Rit-WT and CA-Epac2 after pretreatment with PP2 (10 μM), PP3 (10 μM), or vehicle DMSO, and GTP-Rit levels were analyzed as described above. (E) Rit-WT–transfected cells were serum starved (5 h) and pretreated with PP2 (10 μM), PP3 (10 μM), or DMSO for 30 min before stimulation with 8-CPT-2-Me-cAMP (25 μM). GTP-Rit levels were measured from whole cell lysates as described above. (F) Serum-starved PC6 cells cotransfected with 3xFLAG-Rit-WT and either Src-S17A, the indicated amount of CA-Src-S17A, or empty vector (EV), were stimulated with PACAP38 (10 nM). GTP-Rit levels were analyzed as described above. The data in each panel are representative of the results from a minimum of three independent experiments.
Figure 3.
Figure 3.
TrkA receptor activity is required for PACAP38- and Epac-mediated Rit activation. (A) nnr5 cells expressing 3xFLAG-Rit-WT were cotransfected with or without CA-Epac2 and serum starved before exposure to PACAP38 (10 nM) or 8-CPT-2-Me-cAMP (25 μM). GTP-Rit levels were analyzed as described in Materials and Methods. (B) nnr5 cells were transfected with 3xFLAG-Rit-WT in the presence or absence of TrkA receptor (WT-TrkA), subjected to serum starvation (5 h) and stimulated with PACAP38 (10 nM). Cellular GTP-Rit levels were analyzed using GST-RGL3-RBD pull-down as described above. Note that TrkA expression restored PACAP-mediated Rit activation. (C) nnr5 cells expressing 3xFLAG-Rit-WT were transfected with CA-Epac2 and/or WT-TrkA as indicated, and stimulated with 8-CPT-2-Me-cAMP (25 μM) after serum starvation (5 h). GTP-bound Rit levels were determined by RGL3-RBD pull-down. The results in A–C are representative of three to five independent experiments. (D) Total cell lysates (100 μg) were prepared from PC12, PC6, nnr5, NIH-3T3 and Madin-Darby canine kidney (MDCK) cells, subjected to fractionation by SDS-PAGE, and examined by immunoblotting. Note that nnr5, NIH-3T3, and MDCK cells fail to express detectable TrkA.
Figure 4.
Figure 4.
PACAP38-mediated Rit activation involves PACR1-dependent TrkA transactivation. (A) PC6 cells were transfected with either shCTR or shPACR1-384 and then subjected to G418 (400 μg/ml) selection for 60 h. Total RNA was isolated and RT-PCR used to monitor PACR1 silencing. (B) PC6 cells cotransfected with 3xFLAG-Rit-WT and either shCTR or shPACR1-384 were starved in serum-free DMEM (5 h) and stimulated with PACAP38 (20 nM). Cell lysates were prepared and subjected to GST-RGL3-RBD pull-down. (C) PC6 cells transfected with either shCTR or shPACR1-384 were enriched with G418 (400 μg/ml; 60 h) and serum starved (5 h) before stimulation with either PACAP38 (20 nM) or NGF (100 ng/ml). Total cell lysates (1 mg) were prepared and subjected to anti-TrkA immunoprecipitation. Anti-phosphotyrosine specific immunoblotting was used to detect activate TrkA, and the stripped membrane was reprobed with anti-TrkA antibody to demonstrate equal loading. (D) PC6 cells were pretreated with PP2 (10 μM), PP3 (10 μM), PTX (100 ng/ml), ddA (50 μM), or dimethyl sulfoxide (DMSO); stimulated with PACAP38 (20 nM); and total cell lysates were prepared. NGF stimulation (100 ng/ml) served as positive control. Endogenous TrkA was immunoprecipitated (1 mg of total cell lysate) and activated receptor identified by anti-phosphotyrosine immunoblotting. (E) PC6 cells were transfected with c-Src-WT in the presence or absence of CA-Epac2, serum starved, and then stimulated with PACAP38 (10 nM), EGF (100 ng/ml), or not treated (phosphate-buffered saline [PBS]). Total lysates (500 μg) were subjected to anti-c-Src immunoprecipitation, and active Src levels were examined by phosphotyrosine-specific immunoblotting. Note that both PACAP38 and CA-Epac2 result in c-Src activation. (F) PC6 cells expressing c-Src-WT were starved for 5 h before stimulation with 8-CPT-2-Me-cAMP (25 μM) for 5, 10, or 30 min, and the phosphotyrosine levels of Src determined as described above. (G) PC6 cells expressing c-Src-WT were starved (5 h) and pretreated with or without PTX (100 ng/ml; 30 min) before stimulation with either PACAP38 (20 nM; 10, 30, or 60 min) or CTX (2.5 μg/ml; 10, 30, or 60 min). Total cell lysates were prepared and analyzed for Src tyrosine phosphorylation analysis as described above. The data in each panel are representative of the results from a minimum of three independent experiments.
Figure 5.
Figure 5.
PACAP/Epac-dependent Rit activation and TrkA transactivation require TrkAY499. (A and B) NIH-3T3 cells were transfected with 3xFLAG-Rit-WT in the presence or absence of TrkA-WT, TrkA-Y499F, TrkA-Y794F, or TrkC-WT as control (A) and then serum starved (5 h) before stimulation with NGF (100 ng/ml; 15 min) or PACAP38 (10 nM; 20 min). GTP-bound Rit levels were determined as described in Materials and Methods. NIH-3T3 (C and E) or PC6 (D) cells expressing either HA-TrkA-Y499F or -Y794F were stimulated with PACAP38 (20 nM; 20 min) or 8-CPT-2-Me-cAMP (25 μM; 30 min [E] or as indicated [D]) after starvation with serum-free DMEM (5 h). Total cell lysates were subjected to anti-TrkA or anti-HA immunoprecipitation and TrkA activation examined by anti-phosphotyrosine immunoblotting. (F) NIH-3T3 cells expressing HA-TrkA-WT or HA-TrkA-Y794F were starved for 5 h and subsequently pretreated with PTX (100 ng/ml), ddA (50 μM), PP2 (10 μM), or Rp-cAMP (50 μM) for 30 min before stimulation with PACAP38 (20 nM) for 20 min. NIH-3T3 cells expressing HA-TrkA-WT served as control. TrkA activation was analyzed as described in A. (G) Epac1 silencing attenuates PACAP38-Epac signaling but not NGF-mediated Src and TrkA activation. PC6 cells were transfected with HA-TrkA-WT and C-Src-WT in presence of either shCTR or shEpac1–1501 and subjected to G418 (400 μg/ml) selection to enrich for transfected cells. Note that PC6 cells express Epac1 but not Epac2 (Shi et al., 2006). Cells were then starved with serum-free DMEM for 5 h before be stimulated with PACAP38 (20 nM; 10, 30, or 60 min), 8-CPT-2-Me-cAMP (25 μM; 10, 30, or 60 min), CTX (2.5 μg/ml; 10, 30, or 60 min), or NGF (100 ng/ml; 15 or 30 min). Total lysates were subsequently prepared, subjected to anti-TrkA (2 μg) and anti-C-Src (4 μg) immunoprecipitation, and resolved by SDS-PAGE, and then the phosphotyrosine levels of TrkA and Src were examined by phosphotyrosine-specific immunoblotting. The results are representative of three or four independent experiments.
Figure 6.
Figure 6.
C3G is not required for Rit activation, but the Shc1/Grb2 adaptors contribute to PACAP38-dependent neuronal differentiation. (A) Anti-C3G immunoblotting demonstrates silencing of endogenous C3G after transfection with shC3G-128 and shC3G-2739 but not shCTR, in PC6 cells. (B) PC6 cells expressing 3xFLAG-Rit-WT were cotransfected with either shCTR or shC3G-2739 and then stimulated with PACAP38 (20 nM) or NGF (100 ng/ml). GTP-bound Rit levels were determined by GST-RGL3-RBD pull-down. (C) PC6 cells expressing Shc1-WT-3xFLAG were either cotransfected with CA-Src, CA-Epac2, or stimulated with PACAP38 (20 nM) or 8-CPT-2-Me-cAMP (25 μM) after serum starvation. Total cell lysates were prepared, subjected to anti-FLAG immunoprecipitation (500 μg), and the levels of phosphorylated Shc1 determined by anti-phosphotyrosine immunoblotting. (D) Neurite outgrowth was initiated by cotransfection of PC6 cells with 3xFLAG-Rit-Q79L and either empty-3xFLAG vector, Shc1-FFF-3xFLAG, or Grb2-R86K-3xFLAG, or by the addition of NGF (100 ng/ml) or PACAP38 (20 nM). Cells were replated (1:4 dilution) after transfection and enriched by G418 (400 μg/ml) selection. Neurite outgrowth was analyzed at day 7, and the percentage of neurite-bearing cells (top) and neurite number per cell (bottom) calculated as described in Materials and Methods. The results were represented as mean ± SD from three independent experiments performed in triplicate. (E) PC6 cells were starved in serum-free DMEM (10 h) and then pretreated with PP2 (10 μM), PP3 (10 μM), Rp-cAMP (50 μM), ddA (50 μM), PTX (100 ng/ml), or dimethyl sulfoxide (DMSO, vehicle control) for 30 min before stimulation with or without PACAP38 (20 nM) for 20 min. Total cell lysates (500 μg) were prepared and subjected to either anti-SOS1 or anti-SOS2 immunoprecipitation, and active SOS levels were determined by anti-phosphotyrosine immunoblotting. (F) PC6 cells were transfected with 3xFLAG-Rit-WT in the presence or absence of either FLAG-Shc1–3F (FFF) or Myc-Grb2-R86K and starved for 5 h before stimulation with either PACAP38 (20 nM) or NGF (100 ng/ml) as indicated. GTP-Rit levels were examined as described in Materials and Methods. The results are representative of three independent experiments.
Figure 7.
Figure 7.
SOS1/2 silencing inhibits PACAP38- and NGF-mediated Rit activation in PC6 cells, but SOS1 does not function as an in vitro RitGEF. (A) PC6 cells were cotransfected with 3xFLAG-Rit-WT and CA-SOS1, and cell lysates prepared after starvation in serum-free DMEM (5 h). GTP-Rit levels were determined as described in Materials and Methods. (B) PC6 cells expressing shSOS1-4316, shSOS2-3434, or shCTR were enriched by G418 selection (400 μg/ml), and the expression of SOS1 and SOS2 determined by immunoblotting. Note that shSOS2-3434 silences SOS2. (C) PC6 cells were cotransfected with shCTR or siSOS1 (20 nmol) together with shCTR or shSOS2-3434, and enriched by G418 (400 μg/ml; 60 h) selection. Cell lysates were prepared and subjected anti-SOS1 or anti-SOS2 immunoblotting. (D) PC6 cells expressing 3xFLAG-Rit-WT were cotransfected with either siSOS1/shSOS2–3434 or shCTR/shCTR as control and stimulated with PACAP38 (20 nM) or NGF (100 ng/ml). Total cell lysates were subjected to GST-RGL3-RBD precipitation and levels of GTP-Rit determined as described in Materials and Methods. (E) 200 nM Rit (left) or H-Ras (right) loaded with the fluorescent GDP analogue mGDP were incubated alone (open circles), in the presence of 200-fold excess unlabeled GDP (closed squares) or in the presence of unlabeled GDP and 500 nM Sos (open squares). The time-dependent decrease in fluorescence intensity monitors the exchange of protein bound mGDP for GDP. Note that in the absence of excess GDP the G protein nucleotide complex is stable. (F) Schematic diagram of the putative PACAP-Epac-Src-TrkA-SOS-Rit signal transduction cascade. The sites of action of various pharmacological inhibitors (⊣), selective activators (→), and the targets of shRNA silencing reagents (•) are indicated.

Similar articles

Cited by

References

    1. Andres D. A., Rudolph J. L., Sengoku T., Shi G. X. Analysis of rit signaling and biological activity. Methods Enzymol. 2005;407:499–512. - PubMed
    1. Andres D. A., Shi G. X., Bruun D., Barnhart C., Lein P. J. Rit signaling contributes to interferon-gamma-induced dendritic retraction via p38 mitogen-activated protein kinase activation. J. Neurochem. 2008;107:1436–1447. - PMC - PubMed
    1. Arevalo J. C., Yano H., Teng K. K., Chao M. V. A unique pathway for sustained neurotrophin signaling through an ankyrin-rich membrane-spanning protein. EMBO J. 2004;23:2358–2368. - PMC - PubMed
    1. Bernards A., Settleman J. GAP control: regulating the regulators of small GTPases. Trends Cell Biol. 2004;14:377–385. - PubMed
    1. Bos J. L. Epac: a new cAMP target and new avenues in cAMP research. Nat. Rev. Mol. Cell Biol. 2003;4:733–738. - PubMed

Publication types

MeSH terms

Substances

LinkOut - more resources