Comparative Study
. 2010 Mar 10;30(10):3612-23.
doi: 10.1523/JNEUROSCI.5109-09.2010.

Hedgehog signaling governs the development of otic sensory epithelium and its associated innervation in zebrafish

Affiliations
Comparative Study

Hedgehog signaling governs the development of otic sensory epithelium and its associated innervation in zebrafish

Dora Sapède et al. J Neurosci. .

Abstract

The inner ear is responsible for the perception of motion and sound in vertebrates. Its functional unit, the sensory patch, contains mechanosensory hair cells innervated by sensory neurons from the statoacoustic ganglion (SAG) that project to the corresponding nuclei in the brainstem. How hair cells develop at specific positions, and how otic neurons are sorted to specifically innervate each endorgan and to convey the extracted information to the hindbrain is not completely understood. In this work, we study the generation of macular sensory patches and investigate the role of Hedgehog (Hh) signaling in the production of their neurosensory elements. Using zebrafish transgenic lines to visualize the dynamics of hair cell and neuron production, we show that the development of the anterior and posterior maculae is asynchronic, suggesting they are independently regulated. Tracing experiments demonstrate the SAG is topologically organized in two different neuronal subpopulations, which are spatially segregated and innervate specifically each macula. Functional experiments identify the Hh pathway as crucial in coordinating the production of hair cells in the posterior macula, and the formation of its specific innervation. Finally, gene expression analyses suggest that Hh influences the balance between different SAG neuronal subpopulations. These results lead to a model in which Hh orients functionally the development of inner ear towards an auditory fate in all vertebrate species.


Figures

Figure 1.
Figure 1.
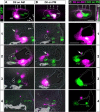
Hh signaling is required for the development of the posterior macula in zebrafish. A–F, Development of anterior and posterior maculae is asynchronic and asymmetric. A–D, DIC images. A′–D″, Corresponding fluorescence of the same otic vesicle in Brn3c-GFP transgenic fish. A, A′, At 22–25 hpf, precocious tether cells are already differentiated (arrowheads). B, B′, From 27–30 hpf later-forming hair cells start accumulating in the AM (arrow). C–C″, Asymmetric positioning of the two maculae is evident at 42–48 hpf as they are visualized in different focal planes (C′ for AM, C″ for PM). At this stage, the PM contains several later-forming hair cells (arrow in C″). D–D″, At 3 dpf, both AM and PM have accumulated more hair cells (compare white brackets in C″ and D″). E, atoh1b expression in the early-forming tether cells (black arrowheads). At 22–25 hpf, atoh1a has expanded in the anterior otic region (red arrowhead in the insert) whereas only few isolated cells expressing this transcript can be detected in the posterior otic region from 25 hpf (see insert). F, At 27–30 hpf, atoh1a is still strongly expressed in the anterior otic region (black arrow), and its expression intensifies in the posteromedial domain (red arrowhead in the insert). G–L, Macular development in CyA-treated fish. G–J, DIC images. G′–J′, Corresponding fluorescence of the same otic vesicle in Brn3c-GFP transgenic fish after CyA treatment. G, G′, At 22–25 hpf, tether cells are formed as in control (arrowheads), consistent with the normal atoh1b expression (K). H, H′, From 27–30 hpf AM accumulates later-forming hair cells (arrow) as prefigured by normal upregulation of atoh1a expression at 22–25 hpf (K, red arrowhead in insert). I–I′, Asymmetric positioning of the two hair cell groups is never achieved in CyA-treated larva, and both are visible at the same focal plane. The posterior sensory epithelium (red arrow) is reduced in size (compare white brackets in I′ and C″). J–J″, At 3 dpf a single macular domain covers the ventral floor of the vesicle since hair cells form ectopically between the initial macular domains (red arrow in J′). L, atoh1a posteromedial domain is absent (red asterisk in the insert). Dotted lines depict the contour of otic epithelium. All images are lateral views with anterior to the left. M, N, Time course of hair cell production in AM (M) and PM (N) in control (blue) and CyA-treated (purple) fish. Data from hair cell counts in the Brn3c-GFP transgenic line.
Figure 2.
Figure 2.
Quantitative and qualitative defects during the formation of the SAG in CyA-treated larvae. A–L, Isl3-GFP control (A, C, E, G, I, K) and CyA-treated (B, D, F, H, J, L) fish at indicated stages. A–D, At 26 hpf, SAG processes are extending towards the anterior (white arrowhead) and posterior (red arrowhead) sensory patch in control embryo (C), and fibers extending towards posterior sensory regions were not found in treated embryos (D). E, F, Lateral views, maximal projections of confocal z-stacks of the SAG. G, H, Coronal sections containing the SAG, maximal projections of z-stacks. The SAG is reduced in size (compare the lengths of white brackets in G and H) and lost its more posterior part (green/white asterisks in E and F/K and L) after inactivation of Hh signaling. Lateral views in DIC optics (A, B, I, J) and fluorescence (C, D, K, L) of ears of fixed 26 hpf and live 3 dpf Isl3-GFP embryos. Dotted white lines in CH and K and L indicate the contour of otic vesicle. Red arrows in E–H indicate fascicles of SAG peripheral processes extending toward the developing cristae, whereas white arrowheads point to individual dendrites innervating the maculae. In G and H, contrast was enhanced in the region within the dotted line, to distinguish individual processes above the otic epithelium. Note that only peripheral processes to the anterior crista fasciculate as normal in CyA-treated fish (H, red arrow), whereas individual dendrites extend to the whole ventral otic epithelium (H, white arrowheads). M, Neuron counts in the SAG of 42–48 hpf and 3 dpf fish after inactivation of Hh signaling (purple), compared with control (blue). ALLg: Anterior lateral line ganglion.
Figure 3.
Figure 3.
Cell proliferation of inner ear structures upon Hh signaling abrogation. AD, TUNEL assay in control and CyA-treated fish at 36–42 hpf. A, B, Lateral views of the otic vesicle (dotted black line). C, D, Transverse sections showing the otic epithelium, and the SAG indicated by dotted lines. E–G, Transverse section of an ear at the level of the PM in 48 hpf Brn3c-GFP CyA-treated fish: DIC optics (E), fluorescence (F), and merged (G) images. Three GFP+ hair cells (asterisks in E and arrowhead in G) are extruded from the otic epithelium to the underlying mesenchyme. Note that the sensory epithelium appears monolayered, suggesting a defect in the maintenance of hair cell/supporting cell organization in the posterior sensory domain of treated fish at 48 hpf. H, I, Lateral views of control and CyA-treated Brn3c-GFP embryos after anti-BrdU staining (red). J–Q, Anti-pH3 staining (red) in control (J–M) and CyA-treated (N–Q) Brn3c-GFP embryos. Transverse sections of the ears were ordered from anterior (top) to posterior (bottom). Note that differentiated hair cells in green do not divide or incorporate BrdU. AM: Anterior macula; PM: posterior macula.
Figure 4.
Figure 4.
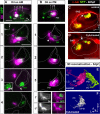
Neurons innervating AM and PM are topologically segregated within the SAG and project centrally to distinct adjacent regions. A, B, Single DiI injections in the AM (A) or PM (B) of Brn3c-GFP fish at 42–48 hpf. Upper row shows lateral views of injected ears under fluorescence, and the level of transverse sections is indicated (ordered from 1 to 4, anterior to posterior). Fish sectioned at equivalent anteroposterior levels allow comparing the position of utricular and saccular neurons according to the same morphological landmarks. Labeled neurons corresponding to injected AM are found in the anteriormost section of the ear at the level of the AM sensory epithelium (A, section 1), whereas neurons corresponding to PM are visible in two sections beneath the medial wall of the otic vesicle and the PM (B, sections 2 and 3). The axons enter the hindbrain and bifurcate in ascending and descending branches at a level between sections 1 (for utricular neurons) and 2 (for saccular neurons) (arrow). DiI injection in PM can result in colabeling of neural processes extending to the posterior crista (PC in section 4). Dotted lines in the sections delineate the limits of SAG visible in DIC optics. Contrast enhancement of the purple channel in the zone in which cell bodies are located was necessary due to the very bright DiI-staining at the point of injection. Fluorescent images of section 1 for A and section 2 for B are composite images obtained by maximal projection of 2 to 3 different focal planes to see the maximal number of labeled cell bodies; idem for section 4 in B and C to allow the reconstitution of the entire length of neuronal processes contacting the PC. C, Double injection with DiI in the AM and DiO in the PM of the same ear of a 42–48 hpf Brn3c-GFP embryo. Upper row shows lateral view of whole-mount fish after injection, and the level of transverse section is indicated (ordered 1–4, from anterior to posterior). Section 2 shows the labeled central projections (see white arrow), with utricular neurons projecting more medially (DiI, purple) and saccular neurons more laterally (DiO, green). Section 4 is from another injected fish and illustrates the colabeling of PC innervation after tracing of the saccular neurons. D, Dorsal coronal section of a fish processed for DiI/DiO injections, showing adjacent but distinct areas of central projections for utricular and saccular neurons. All images are fluorescent pictures of single focal plane except for section 4. AM, Anterior macula; PM, posterior macula; NM, neuromast. Scale bar, 50 μm; enlargement in D, 25 μm. Axes are indicated in the picture.
Figure 5.
Figure 5.
Inactivation of Hh signaling disrupts the specific innervation pattern of the maculae. A, B, DiI injections in Brn3c-GFP fish treated with CyA. Upper row shows fluorescence images of the ear in lateral views after injection. Fish were transversally sectioned and the level of the sections ordered from 1 to 4 as in Figure 4. A, DiI-labeled neurons corresponding to AM are visible in sections 1–2. SAG is reduced compared with control such as no otic neurons are present in sections 3–4. Section 3 shows a peripheral process originating from a labeled anterior neuron (arrowhead) extending towards the remaining PM and contacting a posterior hair cell (insert, dotted lines indicate the contour of the otic epithelium). Contrast enhancement of the purple channel allows seeing the misrouted neural processes of posterior neurons innervating the AM in section 3. B, Only few neurons are detected in section 1 (arrowhead) after DiI injection in the PM, and no neuron is visible in more posterior sections (sections 2–3) in contrast to control fish. The few labeled saccular neurons extend processes to the AM, as detailed in two different focal planes (1′-1′′) at the level of GFP-positive cells of the AM of section 1. C, D, Dorsal views of Brn3c-GFP embryos after anti-acetylated tubulin staining (red) showing that fibers from the anterior portion of the SAG were misrouted in CyA-treated fish (arrow in D). E, F, 3D model of the topological organization of the SAG in control and CyA-treated Isl3-GFP fish, performed with BioVis 3D software. Images were obtained by reconstructions of the SAG volume from z-stacks of transverse sections. LC/AC/PC: lateral/anterior/posterior cristae. Scale bar, 50 μm. Axes are indicated in the pictures.
Figure 6.
Figure 6.
Role of Hh signaling in otic neuronal identity. A, Dorsal views of ngn1 and neuroD4, and ventral views of neuroD expression in control and CyA-treated fish. ngn1, neuroD and neuroD4 expression disappears from the posteromedial otic territory in CyA-treated fish (asterisks). Anterior is to the left. B, C, Transverse sections from anterior (a) to posterior (d) throughout the otic vesicle of 26 hpf control embryos hybridized with neuroD4 (B) and gata3 (C). At this stage, the forming SAG is found only in the most anterior section (a, dotted lines). Brackets in b sections indicate the broader delaminating zone. Arrowheads in c indicate the posterior part of the neurogenic domain. D, Transverse sections from anterior (a, a′) to posterior (d, d′) through the otic vesicle of gata3-hybridized embryos at 32–35 hpf. The SAG extends in the two first sections (a, b; dotted lines). Note the excess of gata3-expressing neurons within the SAG of CyA-treated embryo, compared with control.

Similar articles

Cited by

References

    1. Andermann P, Ungos J, Raible DW. Neurogenin1 defines zebrafish cranial sensory ganglia precursors. Dev Biol. 2002;251:45–58. - PubMed
    1. Bell D, Streit A, Gorospe I, Varela-Nieto I, Alsina B, Giraldez F. Spatial and temporal segregation of auditory and vestibular neurons in the otic placode. Dev Biol. 2008;322:109–120. - PubMed
    1. Bermingham NA, Hassan BA, Price SD, Vollrath MA, Ben-Arie N, Eatock RA, Bellen HJ, Lysakowski A, Zoghbi HY. Math1: an essential gene for the generation of inner ear hair cells. Science. 1999;284:1837–1841. - PubMed
    1. Bever MM, Fekete DM. Ventromedial focus of cell death is absent during development of Xenopus and zebrafish inner ears. J Neurocytol. 1999;28:781–793. - PubMed
    1. Bok J, Bronner-Fraser M, Wu DK. Role of the hindbrain in dorsoventral but not anteroposterior axial specification of the inner ear. Development. 2005;132:2115–2124. - PubMed

Publication types

MeSH terms

LinkOut - more resources