Comparative Study
. 2010 Mar 10;30(10):3663-74.
doi: 10.1523/JNEUROSCI.5621-09.2010.

Developmental tuning and decay in senescence of oscillations linking the corticospinal system

Affiliations
Comparative Study

Developmental tuning and decay in senescence of oscillations linking the corticospinal system

Sara Graziadio et al. J Neurosci. .

Abstract

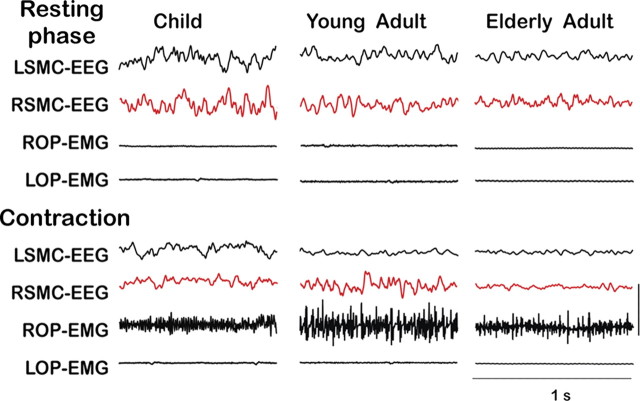
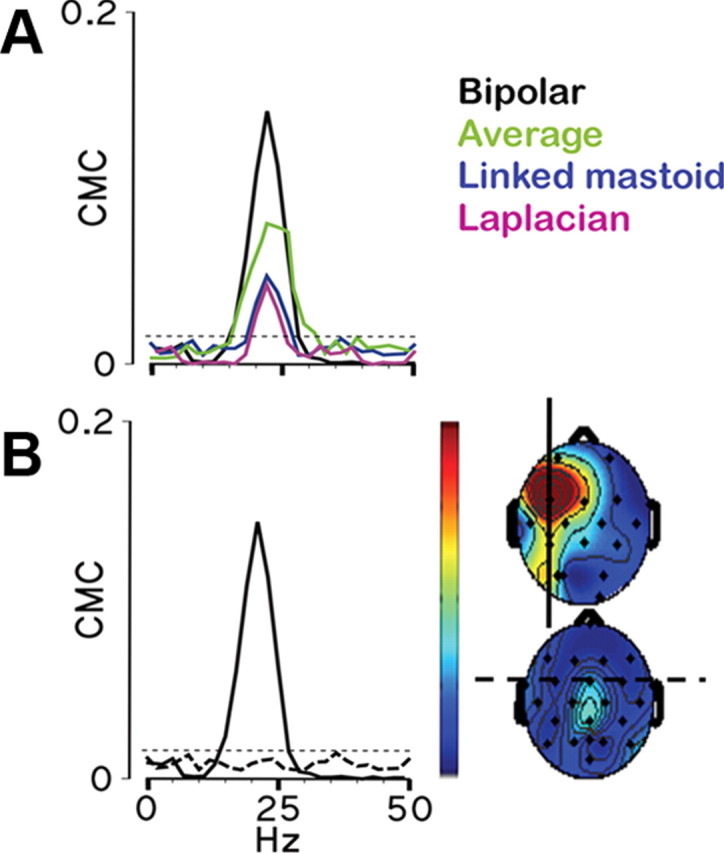
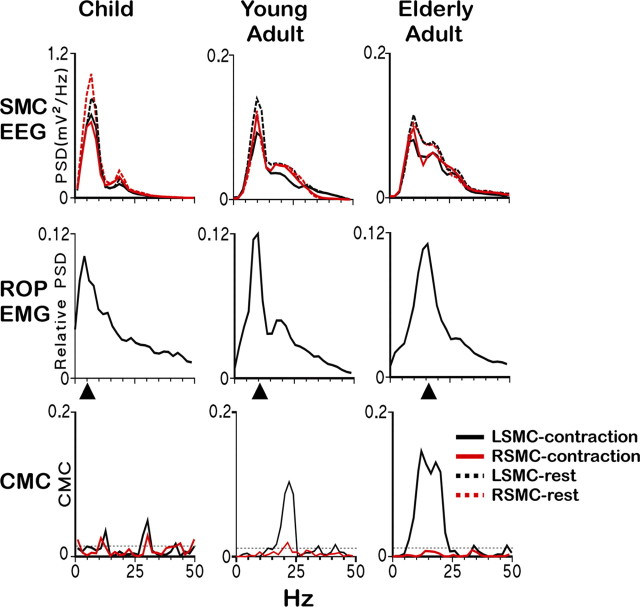
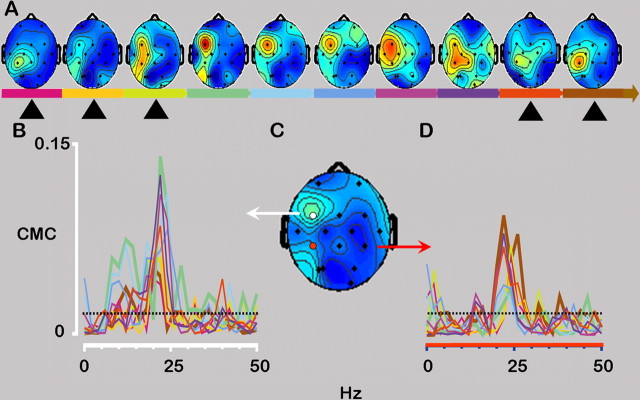
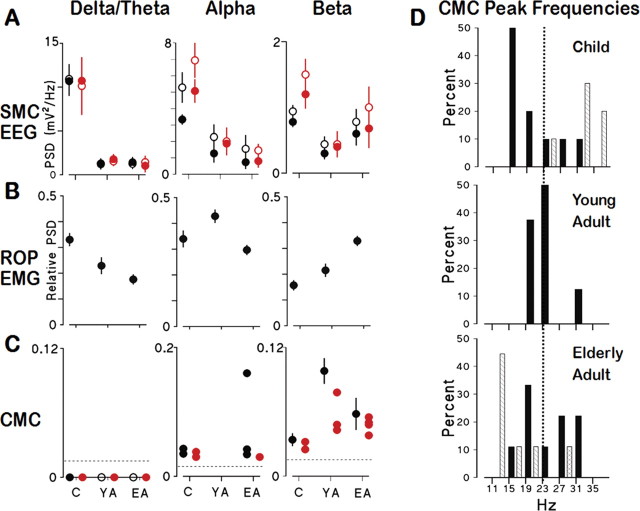
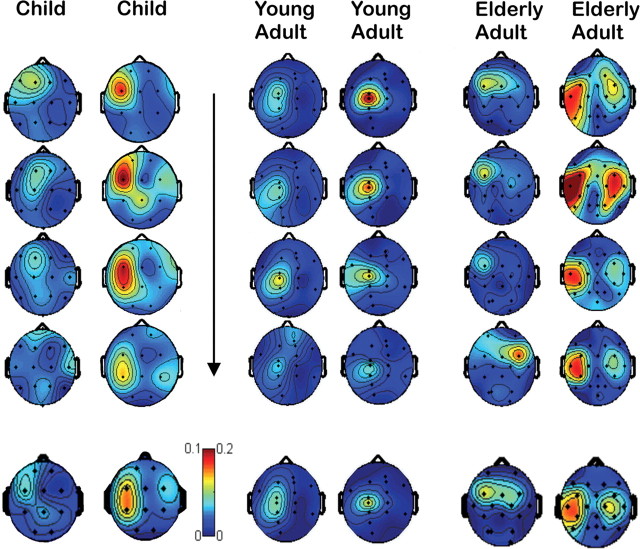
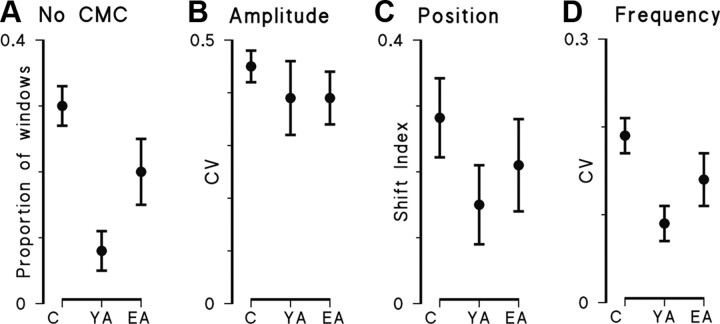
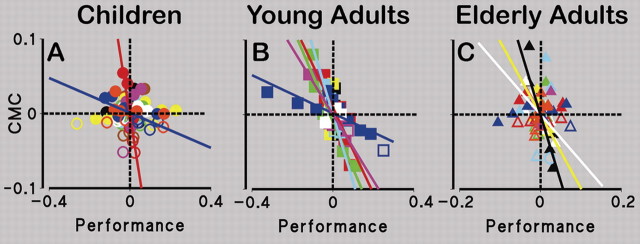
There is increasing evidence of the importance of synchronous activity within the corticospinal system for motor control. We compared oscillatory activity in the primary sensorimotor cortex [EEG of sensorimotor cortex (SMC-EEG)] and a motor neuronal pool [surface electromyogram of opponens pollicis (OP-EMG)], and their coherence in children (4-12 years of age), young adults (20-35 years of age), and elderly adults (>55 years of age). The ratio between lower (2-13 Hz) and higher (14-32 Hz) frequencies in both SMC-EEG and OP-EMG decreased with age, correlating inversely with motor performance. There was evidence for larger, more distributed cortical networks in the children and elderly compared with young adults. Corticomuscular coherence (CMC) was present in all age groups and shifted between frontal and parietal cortical areas. In children, CMC was smaller and less stationary in amplitude and frequency than in adults. Young adults had single peaks of CMC clustered near the modal frequency (23 Hz); multiple peaks with a broad spread of frequencies occurred in children and the elderly; the further the frequency of the maximum peak CMC was from 23 Hz, the poorer the performance. CMC amplitude was inversely related to performance in young adults but was not modulated in relation to performance in children and the elderly. We propose that progressive fine-tuning of the frequency coding and stabilization of the dynamic properties within and between corticospinal networks occurs during adolescence, refining the capacity for efficient dynamic communication in adulthood. In old age, blurring of the tuning between networks and breakdown in their integration occurs and is likely to contribute to a decrement in motor control.


Figures

Figure 1.
Figure 1.
SMC-EEG and EMG activity at rest and during right hand contraction. Paradigmatic examples in: a child 8 years of age, a young adult 22 years of age, and an elderly adult 75 years of age. The top section was recorded while the subject was at rest, and the lower section while contracting ROP. The upper two traces for each section are bipolar derivation SMC signals on the left (LSMC-EEG, black line) and on the right (RSMC-EEG, red line). The third and fourth traces are EMG signals recorded from ROP and LOP. The scale bar represents 50 μV for EEG and 200 μV for EMG. While only the LSMC-EEG is suppressed during contraction in the young adult, there is bilateral suppression of the LSMC-EEG and RSMC-EEG in the child and in the elderly adult, and no overt activity in LOP-EMG.
Figure 2.
Figure 2.
CMC and its properties. A, Comparison of the CMC spectra obtained using Laplacian transformation or different referencing methods, demonstrating higher CMC derived from a bipolar derivation. B, Comparison of the effect on CMC of different orientations of the bipolar derivations centered on FC3. On the left, CMC spectra (C3–F3, continuous line; FC1–FC5, dashed line). On the right, the topographic distribution of CMC in the beta band in the anterior–posterior (continuous line) and medial–lateral (dashed line) directions. For the topographic distribution, the color scale gives CMC values 0–0.2. The dotted horizontal line in all the CMC spectra indicates the 95% confidence level for a CMC significantly different from zero. Topographic distributions were realized with EEGLAB software (Delorme and Makeig, 2004), considering the coordinates of the electrode in the 5–10 system (Oostenvelda and Praamstrac, 2001) corresponding to the midpoint between the two bipolar derivations and using the CMC values in the frequency band in which maximum values were observed.
Figure 3.
Figure 3.
Spectral properties and reactivity of SMC-EEG, relative ROP-EMG, and CMC: representative data. Data are plotted from a child, a young adult, and an elderly adult. SMC-EEG: PSDs of the SMC-EEG of the primary sensorimotor cortex activity, as defined in the Materials and Methods section; note that in SMC-EEG the scales on the y-axis are different for the child compared with the young and elderly adults, and unilateral mu suppression in LSMC-EEG occurs in the young adults during contraction of ROP while bilateral mu suppression is observed in the child and in the elderly adult. Relative ROP-EMG: As absolute EMG power decreases during life, which may reflect contributions of non-neuronal factors, the relative powers of EMG recorded over ROP were reported; the black arrowheads indicate the projections on the x-axis of the maximal peak of the ROP-EMG PSD: the shift with age is evident. CMC, CMC spectra. Black lines, Left/contralateral SMC; red lines, right/ipsilateral SMC; solid lines, during contraction of ROP; dashed lines, while ROP is relaxed.
Figure 4.
Figure 4.
CMC time variability studied by the sliding window analysis. A, Topographic distribution of CMC in the beta band using bipolar derivations in the anterior–posterior axis (see Materials and Methods). B–D, The arrow on the bottom gives the color coding for the spectra obtained in consecutive time windows (graphed in B and D) from bipolar derivation indicated in C, where the topographic distribution of CMC is estimated using the whole-period analysis. The shift in the site of maximum CMC over time is evident. Note that during some time windows (black arrowheads), maximally during the “brown” window, CMC is higher parietally than frontally, implying that the CMC from the sensory cortex is not simply attributable to volume conduction.
Figure 5.
Figure 5.
Comparison of PI and PIPressure. A, ROP-EMG (in black) and pressure traces (in red) in one representative subject. The green line shows the periods of isometric contraction selected for the analyses. B, C, Intersubject comparison (B) and intrasubject comparison (C). The same color represents the same subject in B and C.
Figure 6.
Figure 6.
Spectral properties of SMC-EEG, ROP-EMG, and CMC: group data. A, PSD of SMC-EEG. Filled circles, During contraction; open circles, during rest; black circles, contralateral SMC; red circles, ipsilateral SMC; children, C; young adults, YA; elderly adults, EA. B, Relative PSD of EMG recorded from ROP. C, The amplitude of the significant CMC peaks. The data are grouped into delta/theta, alpha, and beta frequency bands. The circles and error bars represent means and SEMs, except for CMC in the alpha frequency band, where individual values are plotted, and in the beta frequency band, where data for the ipsilateral SMC are individual values. D, The frequency of the significant CMC peaks in the three age groups. The frequencies are grouped in 4 Hz blocks, and the frequencies on the x-axis represent the first frequency of the block; thus, for example, the first block includes all the subjects with CMC peak frequency in the range 11–14 Hz. Black bars represent the maximum peak within the frequency block; hashed bars, the secondary peak within the frequency block; crossed bars, the tertiary peak within the frequency block. The dashed line indicates the modal value for the frequency of CMC in young adults.
Figure 7.
Figure 7.
CMC time behavior in the three age groups. Representative illustrations of the topographic distributions of CMC estimated using the sliding window analysis (first 4 rows, vertical arrow indicates successive 30 s time windows) compared with the whole-period analysis (last row). CMC in the beta frequency band is plotted from two children (8 and 12 years of age), two young adults (21 and 22 years of age), and two elderly adults (80 and 73 years of age). The color scale indicates CMC values 0–0.1 for children and 0–0.2 for young and elderly adults. Presence of spatial shifting is illustrated in one of the subjects in each age group and the figures also illustrate larger networks in the children and the elderly than in young adults.
Figure 8.
Figure 8.
Stationarity of CMC in the three age groups derived from the sliding window analysis. A, Proportion of time windows without significant CMC. B, The coefficient of variation (CV) of the amplitude of the CMC peak. C, D, The index reflecting the spatial shifting of the CMC peak (C) and the coefficient of variation (CV) of the frequency of the CMC peak (D). Lack of CMC stationarity is evident in all age groups, but most marked in children.
Figure 9.
Figure 9.
Intrasubject relationship between CMC and performance. A–C, The residuals from the mean value of PI and CMC for each subject: children (A); young adults (B); and elderly adults (C). Within each graph, the same color represents the same subject. The colored lines indicate individually significant relationships between PI and CMC. The filled symbols indicate significant CMC, and the open symbols CMC values, which are not significant at the 95% level. Although in children (A) residuals are spread in the four quadrants, in the young adults (B) they are tightly clustered in the first and third quadrants, and in the elderly adults (C), when the relationship between performance and CMC begins to break down, residuals begin again to appear in the second and fourth quadrant.

Similar articles

Cited by

References

    1. Anderson B, Rutledge V. Age and hemisphere effects on dendritic structure. Brain. 1996;119:1983–1990. - PubMed
    1. Andrew C, Pfurtscheller G. Dependence of coherence measurements on EEG derivation type. Med Biol Eng Comput. 1996;34:232–238. - PubMed
    1. Baker SN. Oscillatory interactions between sensorimotor cortex and the periphery. Curr Opin Neurobiol. 2007;17:649–655. - PMC - PubMed
    1. Baker SN, Olivier E, Lemon RN. Coherent oscillations in monkey motor cortex and hand muscle EMG show task dependent modulation. J Physiol. 1997;501:225–241. - PMC - PubMed
    1. Baker SN, Pinches EM, Lemon RN. Synchronization in monkey motor cortex during a precision grip task. II. Effect of oscillatory activity on corticospinal output. J Neurophysiol. 2003;89:1941–1953. - PubMed

Publication types