Comparative Study
. 2010 Mar 10;30(10):3715-27.
doi: 10.1523/JNEUROSCI.4953-09.2010.

Changes in simple spike activity of some Purkinje cells in the oculomotor vermis during saccade adaptation are appropriate to participate in motor learning

Affiliations
Comparative Study

Changes in simple spike activity of some Purkinje cells in the oculomotor vermis during saccade adaptation are appropriate to participate in motor learning

Yoshiko Kojima et al. J Neurosci. .

Abstract

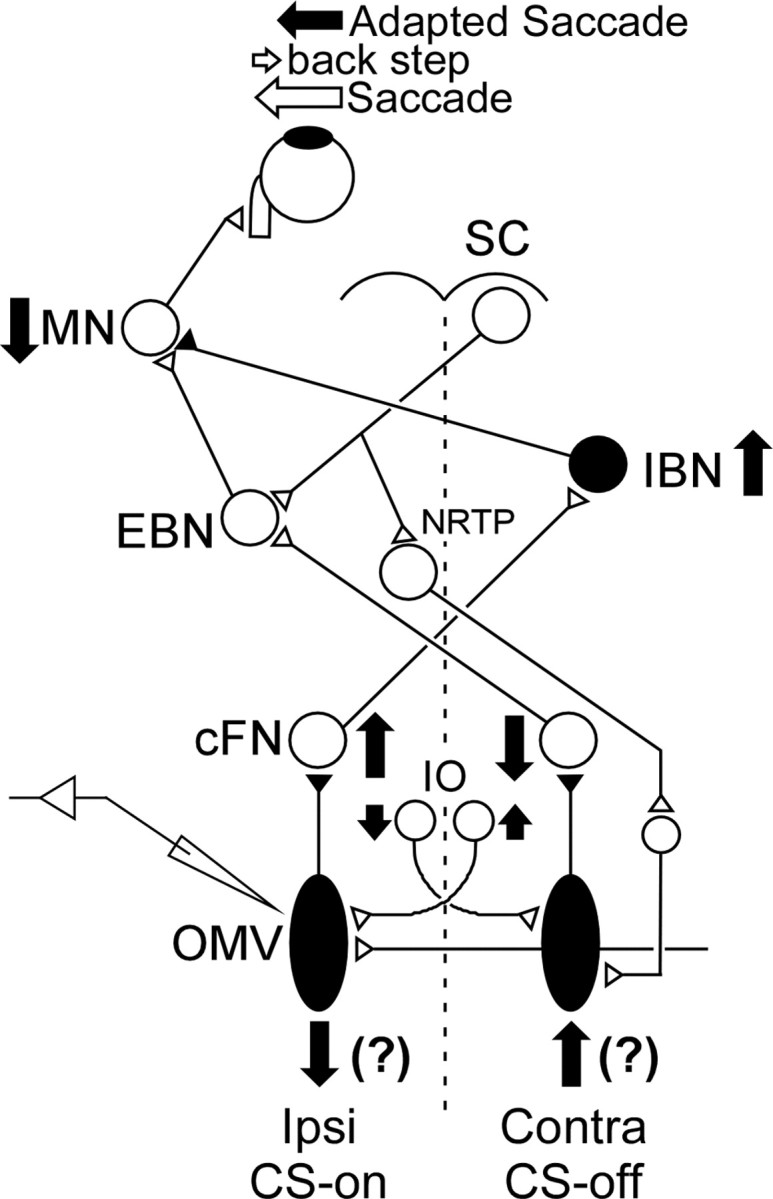
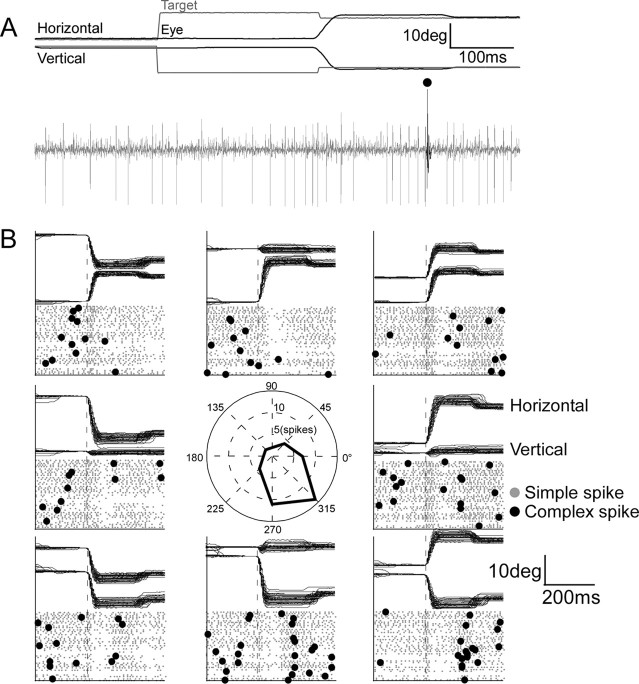
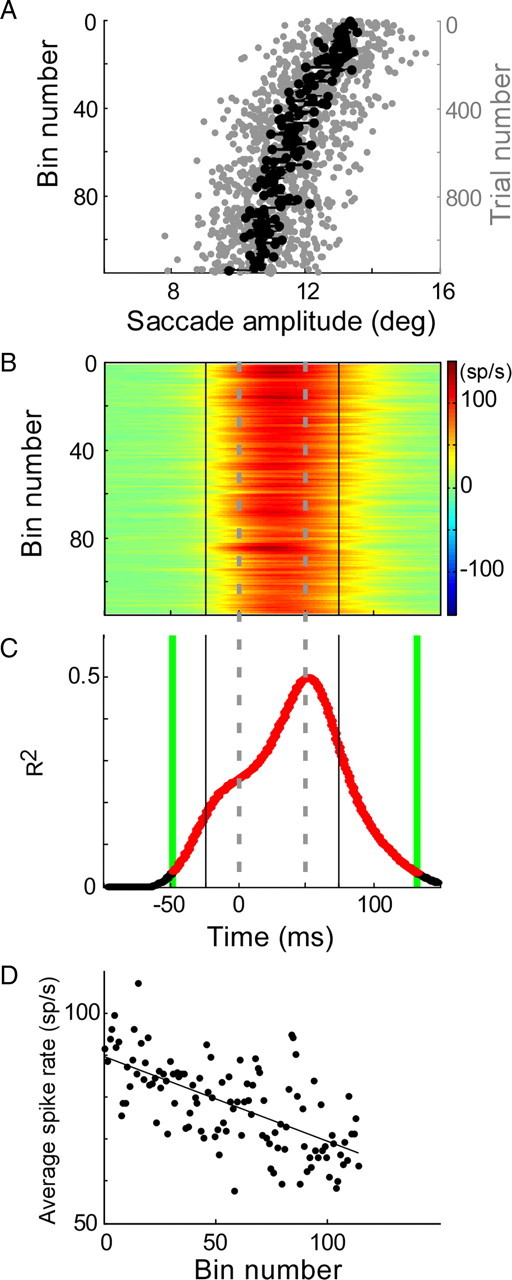
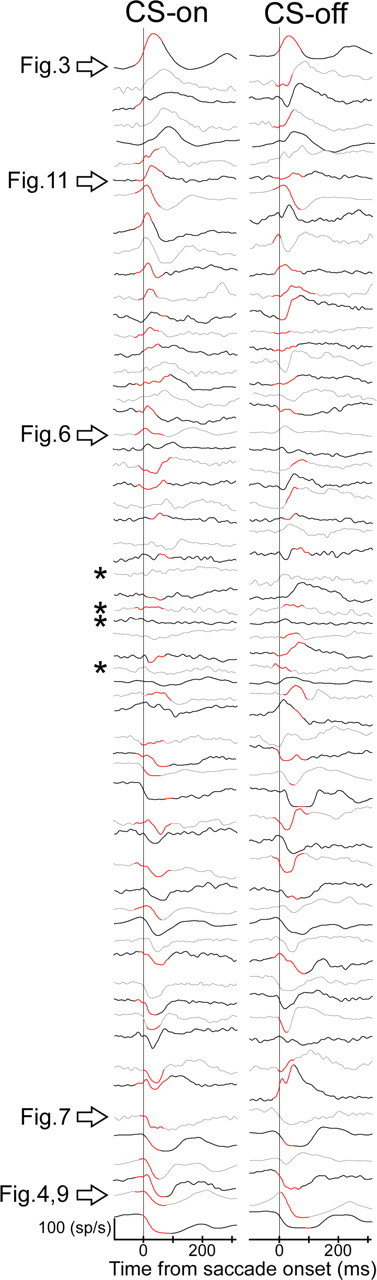
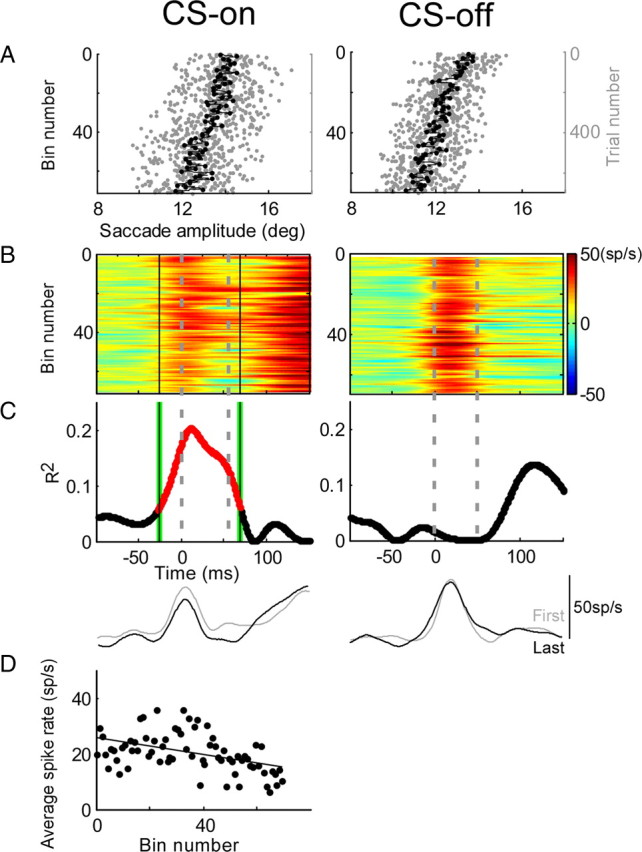
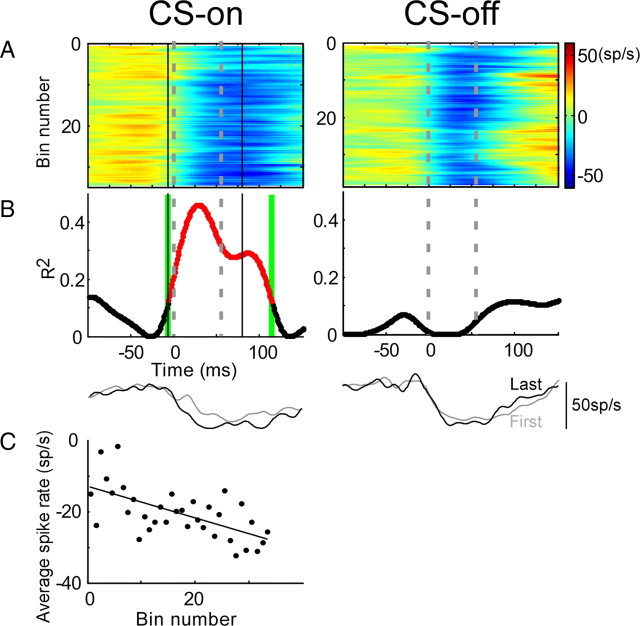
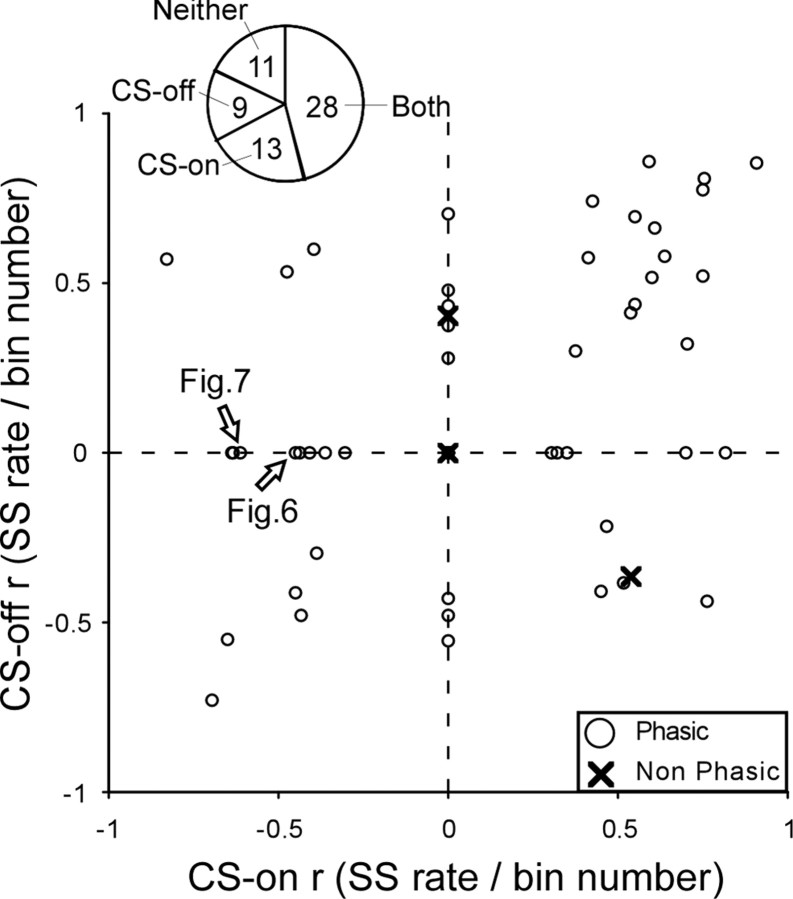
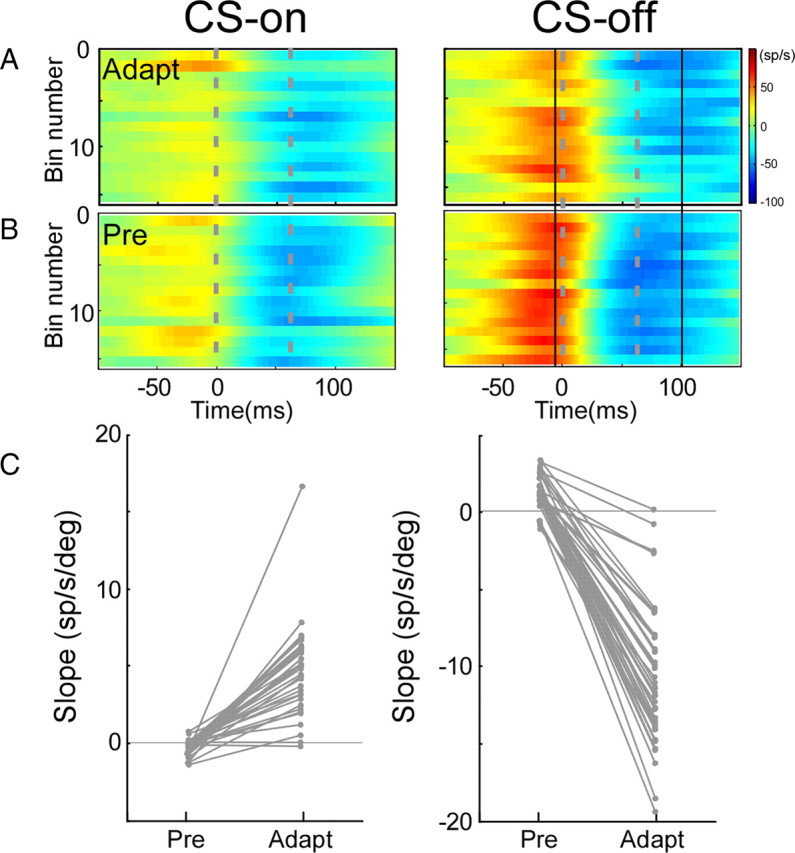
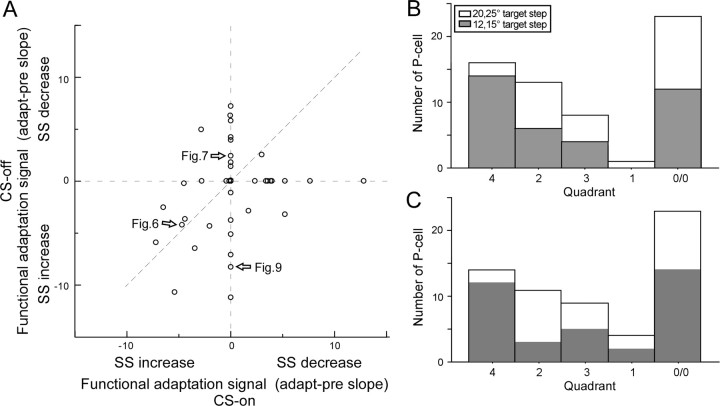
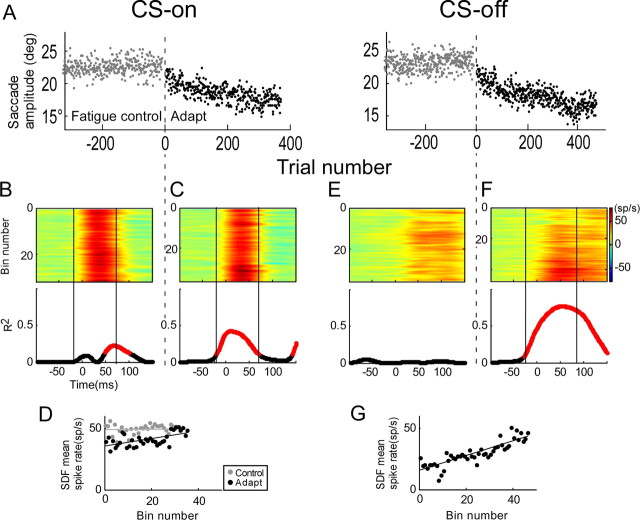
Adaptation of saccadic eye movements provides an excellent motor learning model to study theories of neuronal plasticity. When primates make saccades to a jumping target, a backward step of the target during the saccade can make it appear to overshoot. If this deception continues for many trials, saccades gradually decrease in amplitude to go directly to the back-stepped target location. We used this adaptation paradigm to evaluate the Marr-Albus hypothesis that such motor learning occurs at the Purkinje (P)-cell of the cerebellum. We recorded the activity of identified P-cells in the oculomotor vermis, lobules VIc and VII. After documenting the on and off error directions of the complex spike activity of a P-cell, we determined whether its saccade-related simple spike (SS) activity changed during saccade adaptation in those two directions. Before adaptation, 57 of 61 P-cells exhibited a clear burst, pause, or a combination of both for saccades in one or both directions. Sixty-two percent of all cells, including two of the four initially unresponsive ones, behaved differently for saccades whose size changed because of adaptation than for saccades of similar sizes gathered before adaptation. In at least 42% of these, the changes were appropriate to decrease saccade amplitude based on our current knowledge of cerebellum and brainstem saccade circuitry. Changes in activity during adaptation were not compensating for the potential fatigue associated with performing many saccades. Therefore, many P-cells in the oculomotor vermis exhibit changes in SS activity specific to adapted saccades and therefore appropriate to induce adaptation.


Figures

Figure 1.
Figure 1.
Schematic of the brainstem–cerebellar saccade circuitry underlying an amplitude decrease of leftward saccades. A saccade command from the right SC reaches EBNs, which in turn drive left abducens MNs to generate a saccade. At the same time, a saccade signal from the SC also reaches both the left and right cerebellar vermis via the NRTP. P-cells in the OMV use this incoming signal to create a saccade-related change in SS activity, which inhibits neurons in the ipsilateral cFN. P-cells also receive a signal from the inferior olive (IO) that creates CSs. Left cFN neurons drive contralateral IBNs, which inhibit left abducens motoneurons. Right cFN neurons project to contralateral EBNs, which excite left abducens motoneurons. The solid vertical arrows indicate the changes in activity that should occur in this saccade circuit to produce smaller leftward saccades during adaptation (left solid arrow). The filled neurons are inhibitory, and the open neurons are excitatory.
Figure 2.
Figure 2.
Identification of a P-cell with saccade-related SS activity and determination of its preferred CS direction. A, This P-cell in the right vermis discharged a burst then pause of simple spikes (gray action potentials) for a saccade to the right and down (black traces). In this trial, the target (gray traces) jumped to the left and up during the saccade and a single CS (black action potential) occurred while there was an error between the initial and corrective saccade. B, Direction sensitivity of SS activity (gray dots) for saccades and CS activity (black dots) for target errors in the eight different angular directions shown in the center panel. The center panel shows the number of CSs between the primary and corrective saccade for 40 trials in each direction. Most CSs occurred after erroneous saccades to the right and down (see direction tuning curve).
Figure 3.
Figure 3.
Illustration of the analyses used to document changes in SS activity during adaptation. A, Decrease in saccade amplitude during adaptation. Saccades are shown from top to bottom in order of their occurrence during adaptation (rightward scale). The gray dots show individual saccades; the black dots are averages of every 10 saccades (one bin). B, Average SS SDFs associated with each 10-saccade bin in A and aligned on saccade onset (t = 0). The activity above and below resting rate (green) is indicated by hotter and colder colors, respectively. The gray dashed lines indicate the average saccade duration during adaptation. C, Coefficient of determination (R2) between SS activity and bin number for every millisecond slice in the trial. The linear regression was significant (p < 0.05) for every time slice in the red interval between the green lines (t = −49 to 132 ms). D, Average spike rate as a function of bin number (114 bins for this neuron). Average spike rate is the average SS activity associated with every 10 saccades divided by the analysis interval (±25 ms of the average saccade duration, between vertical black lines in C). Average spike rate decreased significantly with bin number (p < 0.05; r = −0.65).
Figure 4.
Figure 4.
Illustration of the analysis used to compare changes of SS activity with saccade amplitude during adaptation and preadaptation. A, SS activity of a resampled adaptation data subset (112 samples from 274 total). C, Preadaptation data. Colorized SS activity ordered from top according to binned trial number (A) or binned amplitude (C); the right panels in A and C show associated changes in saccade amplitude. B, R2 of the relationship between SS activity of the adaptation subset in A and bin number; the gray curve shows another adaptation subset with no significant interval. D, R2 of the relationship between SS activity in C (left panel) and binned amplitudes in C (right panel). E, Average spike rate versus average saccade amplitude for the resampled subset of adaptation data in A (blue dots; p < 0.05; r = −0.54; slope, −8.23) and the preadaptation data in C (red dots; p < 0.05; r = 0.60; slope, 3.51 sp · s−1 · deg−1). The dashed lines in the right panels of A and C show that the adapt and pre data have the same amplitude ranges. The smallest adapt averages (black dots) never go <10° because it is attributable to saccades lying mostly between 11 and 12°. The black dots are the same amplitude averages that appear in E. F, Slopes of the average spike rate versus amplitude relationships for each of the 50 resampled adaptation subsets and the associated preadaptation data connected by gray lines (black line from data in E). In seven resampled adaptation subsets, there was no significant interval, so the adaptation slope is plotted as 0 (right point of dashed line). Note that the slopes for the preadaptation regressions differed because the analysis interval varied (for details, see Materials and Methods). For 40 of the 50 subsets, the slopes of preadaptation and adaptation regressions were significantly different. The slopes obtained from adapted saccade data were significantly smaller than those from preadaptation saccade data (χ2 test; p < 0.05; mean adapt − pre slopes, −8.27).
Figure 5.
Figure 5.
Average SS discharge patterns of all 61 P-cells for preadapted saccades in the CS-on and -off directions. All patterns are aligned on saccade onset. We loosely ordered the activity from top to bottom according to whether it exhibited a burst, first a burst and then a pause, little perisaccadic change (identified by 4 asterisks), or a pause in the CS-on direction. The arrows identify the P-cells illustrated in other figures. To make it easier to compare CS-on and -off direction activity for the same unit, alternate units are identified by gray and black lines. For the different neurons, saccades could be in response to targets of 12, 15, 20, or 25°. The red highlighted regions on the SDFs indicate the analysis intervals used for each cell and direction. The SDFs without red highlighted regions had no significant analysis interval.
Figure 6.
Figure 6.
Change of SS activity during adaptation for a bursting P-cell. CS-on and -off directions were 315° (left column) and 135° (right column), respectively. A, Amplitude change during adaptation for each saccade (gray dots) and the average of every 10 saccades (black dots) arranged from top to bottom in order of their occurrence during adaptation. B, Colorized binned SS activity presented in the same order as their associated adapted saccades and aligned on saccade onset. The gray dashed lines indicate average saccade duration during adaptation (CS-on, 54.3 ms; CS-off, 49.9 ms). As adaptation reduced saccade amplitude, the burst decreased in the CS-on direction but remained unchanged in the CS-off direction. C, R2 for linear regressions between the SS activity (B) and binned trial number for every 1 ms time slice in a trial. Correlations were significant (p < 0.05, reddened part of curve) between −28 to 69 ms. The black solid lines in B and C indicate the analysis interval. In the CS-off direction, R2 does not reach significance at any time in the trial. The bottom two traces in C show the average SDFs of the first (gray) and last (black) 50 trials during saccade adaptation. D, Average spike rate as a function of bin number for the CS-on direction; the decrease was significant (p < 0.05; r = −0.45).
Figure 7.
Figure 7.
Change of SS activity during adaptation for a pausing P-cell. CS-on and -off directions were 135 and 315°, respectively. A, Colorized binned SS activity during adaptation arranged in order of occurrence and aligned on saccade onset. The gray dashed lines indicate average saccade duration during adaptation (CS-on and -off, 54.7 ms). B, R2 for linear regressions between SS activity (A) and bin number for every 1 ms time slice. Correlations were significant (reddened part of curve, green vertical lines) between −6 to 114 ms (p < 0.05) in the CS-on direction. In the CS-off direction, R2 did not reach significance at any time. The bottom two traces in B show the average SDFs of the first (gray) and last (black) 50 trials during saccade adaptation. C, Average spike rate as a function of bin number for the CS-on direction; the decrease was significant (slope, −0.44; p < 0.05; r = −0.61).
Figure 8.
Figure 8.
Distribution of correlation coefficients of linear regressions between average spike rate and bin number during adaptation for the CS-off and -on directions for all 61 P-cells. Xs indicate the four P-cells with little phasic activity. The arrows identify the P-cells that appeared in the two previous figures. The pie chart shows the number of units with changes in either the CS-on or -off directions, in both directions or in neither direction.
Figure 9.
Figure 9.
Comparison of the regressions of SS activity with saccade amplitudes during adaptation and preadaptation for a representative P-cell (not that illustrated in Fig. 4). CS-on and -off directions were 180 and 0°, respectively. A, B, SS activity of 1 of 50 adaptation subsets (167 and 146 trials in the CS-on and -off directions, respectively) (A) and preadaptation SS activity (B). C, Slopes of average spike rate versus amplitude relationships for each of the 50 regressions on resampled adaptation subsets and the preadaptation data; each pair of slopes is connected by a straight line. In the CS-on direction, the slopes of only five preadaptation regressions and the resampled adaptation subset regressions were significantly different, indicating that the relationship between SS activity and amplitude was the same for adaptation and preadaptation data (χ2 test; p > 0.05). In the CS-off direction, 40 sets had significantly different preadaptation and adaptation regressions, indicating that the slopes of relationships obtained for preadaptation saccades (average of all 50, 1.41 ± 1.11) were significantly greater (χ2 test; p < 0.05; mean diff, −8.27) than those for adaptation saccades (average of all 50, −6.86 ± 4.28).
Figure 10.
Figure 10.
Comparison of the functional adaptation signals in all 61 P-cells. A, The functional adaptation signal (mean difference of the slopes of the average spike rate vs amplitude relationship for adapted minus preadaptation saccades) in the CS-off and CS-on directions. Because adaptation caused a decrease in saccade amplitude, negative slopes indicate an increase in SS activity and positive slopes indicate a decrease. The arrows identify P-cells appearing in previous figures. B, Number of P-cells whose functional adaptation signals in the CS-on and -off directions (A) place them in five different functional categories. Categories include P-cells with data that lie in the fourth quadrant and on its axes (left histogram bar), data that lie in the second quadrant and on its axes (second bar), data from the third quadrant (third bar), data from the first quadrant (fourth bar), and data at the origin (fifth bar). The gray bars indicate that the primary saccade was to 12 or 15° target steps; the white bars indicate data for primary saccades to 20 or 25° target steps. C, Units categorized as in B but analyzed on the whole data set without resampling (see text).
Figure 11.
Figure 11.
Comparison of the relationship of SS activity with trial number during adaptation and during a fatigue control. CS-on and -off directions were 270 and 90°, respectively. A, Saccade amplitude versus trial number during fatigue controls (gray dots from −300 to 0) and adaptation (black dots from 0 to ∼400). B–F, Colorized SS activity presented in order of occurrence and aligned on saccade onset (top panels) and R2 of the relationship between SS activity and bin number for every millisecond time slice (bottom panels) for fatigue controls (B, E) and adaptations (C, F) in the CS-on and -off directions. The vertical black solid lines indicate the analysis intervals. D, G, Average spike rate as a function of bin number for the CS-on and -off directions, respectively. In the CS-on direction, average spike rate increased significantly during adaptation (slope, 0.31; p < 0.31; r = 0.59), but not in the fatigue control (p > 0.05). In the CS-off direction, average spike rate increased significantly only during adaptation (slope, 0.60; p < 0.05; r = 0.86).

Similar articles

Cited by

References

    1. Albus JS. A theory of cerebellar function. Math Biosci. 1971;10:25–61.
    1. Barash S, Melikyan A, Sivakov A, Zhang M, Glickstein M, Thier P. Saccadic dysmetria and adaptation after lesions of the cerebellar cortex. J Neurosci. 1999;19:10931–10939. - PMC - PubMed
    1. Catz N, Dicke PW, Thier P. Cerebellar-dependent motor learning is based on pruning a Purkinje cell population response. Proc Natl Acad Sci U S A. 2008;105:7309–7314. - PMC - PubMed
    1. Cherny E, Galloway E, Kaneko CRS, Noto CT, Robinson FR. Bilateral projection from the oculomotor vermis to the caudal fastigial nucleus in monkey. Soc Neurosci Abstr. 2005;31:755–3.
    1. Fuchs AF, Robinson DA. A method for measuring horizontal and vertical eye movement chronically in the monkey. J Appl Physiol. 1966;21:1068–1070. - PubMed

Publication types

LinkOut - more resources