

Age-dependent maintenance of motor control and corticostriatal innervation by death receptor 3
- PMID: 20220013
- PMCID: PMC2880713
- DOI: 10.1523/JNEUROSCI.1928-09.2010
Age-dependent maintenance of motor control and corticostriatal innervation by death receptor 3
Abstract
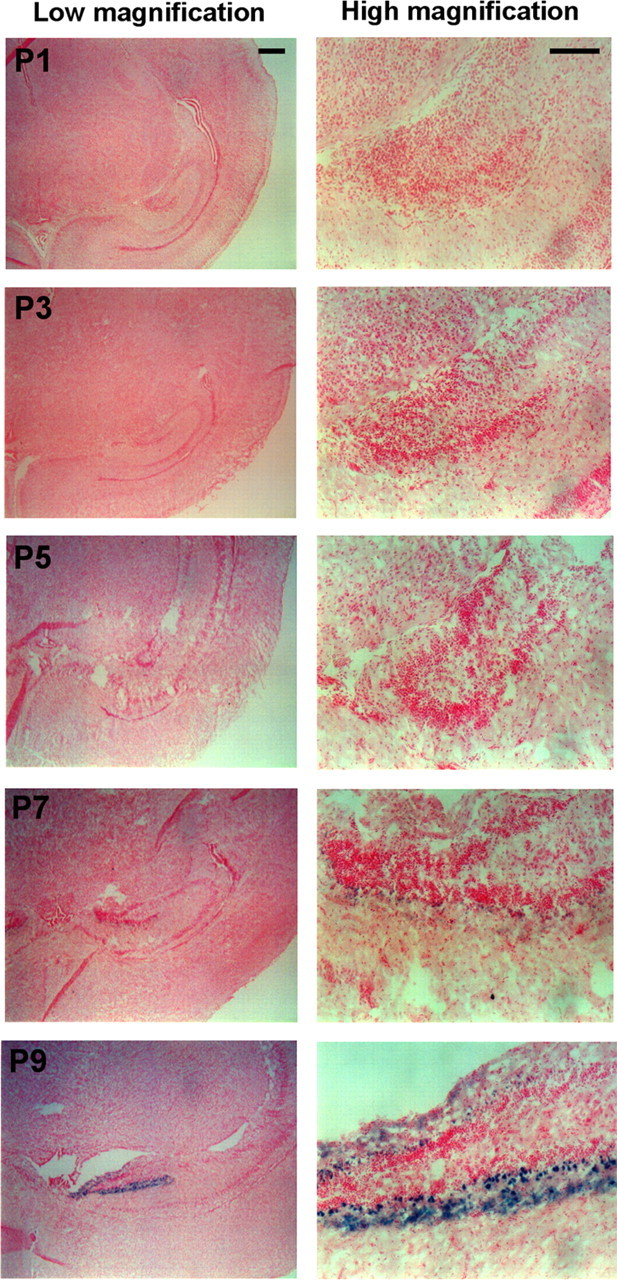
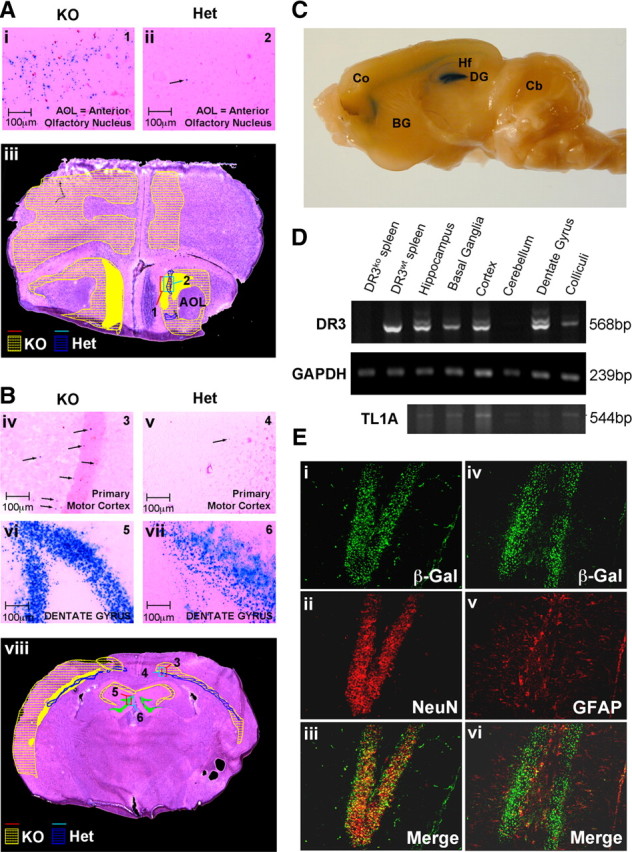
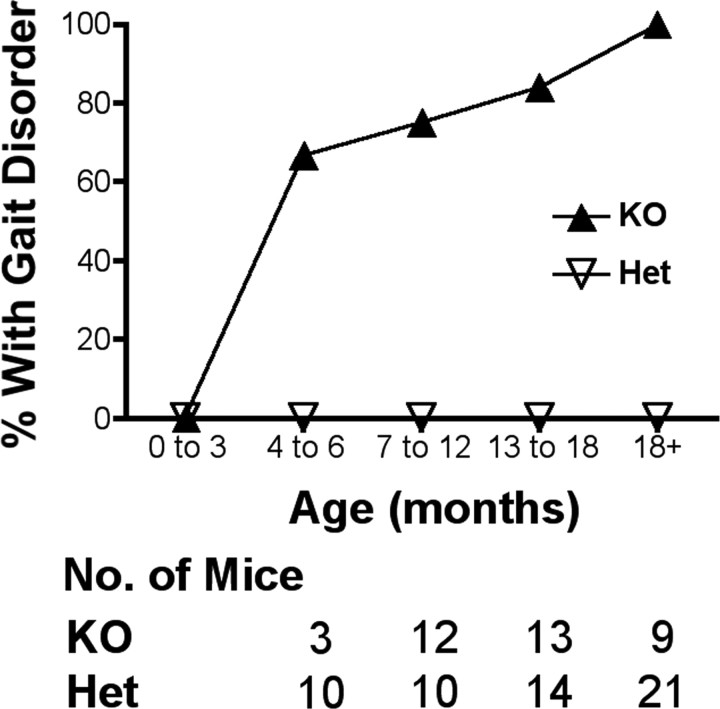
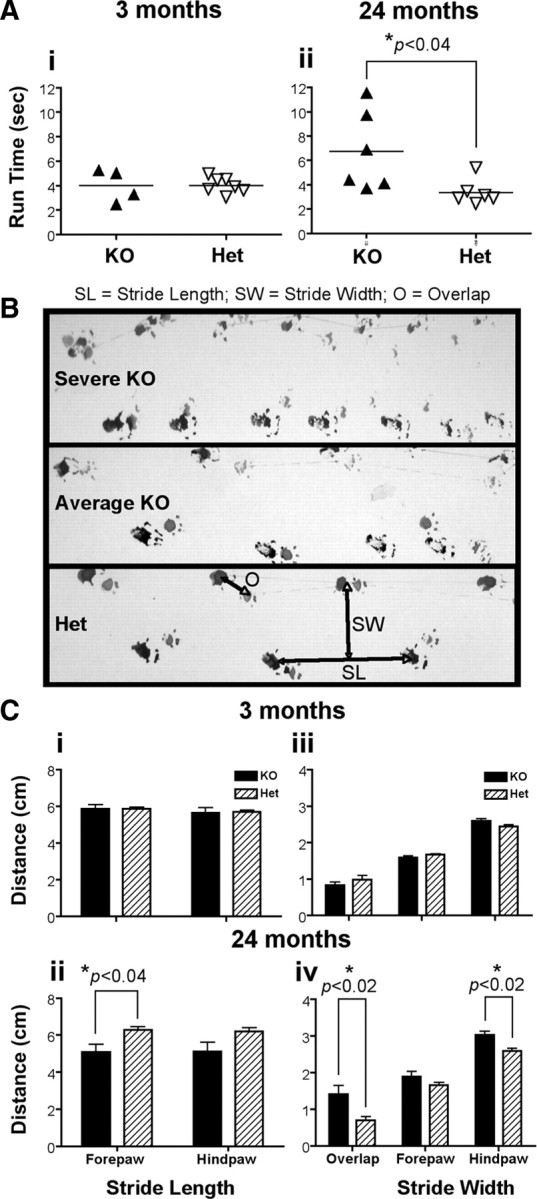
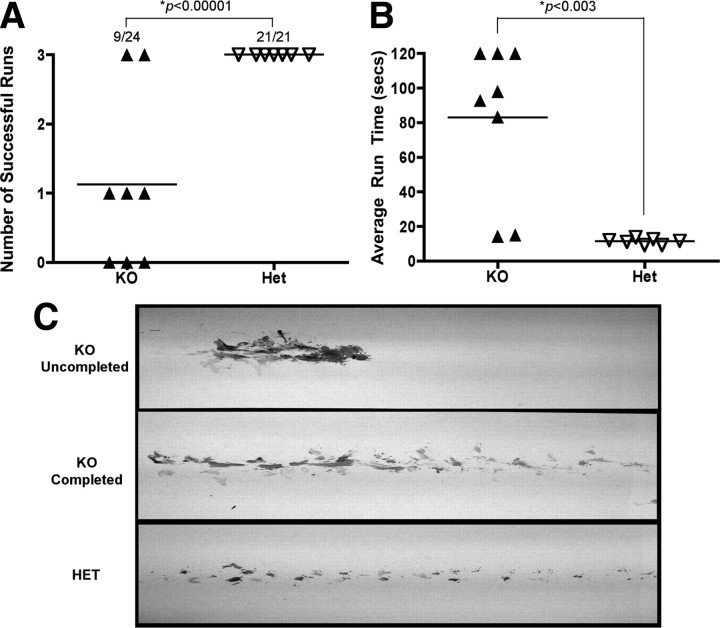
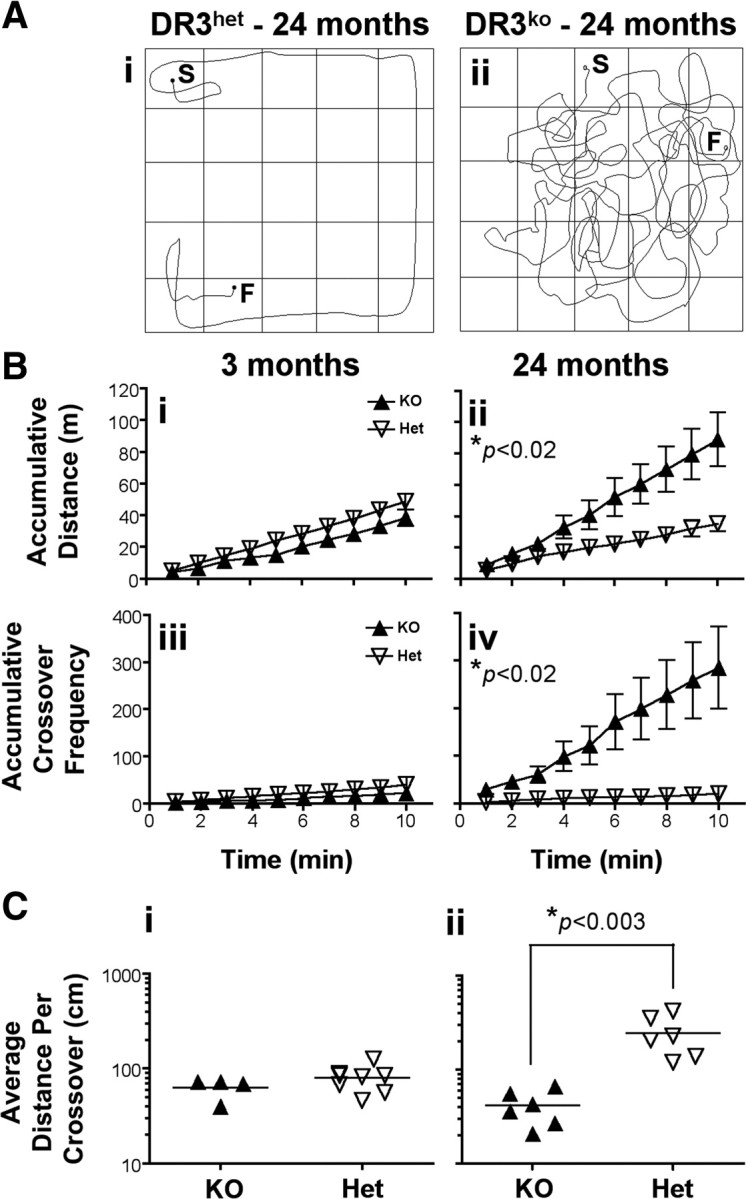
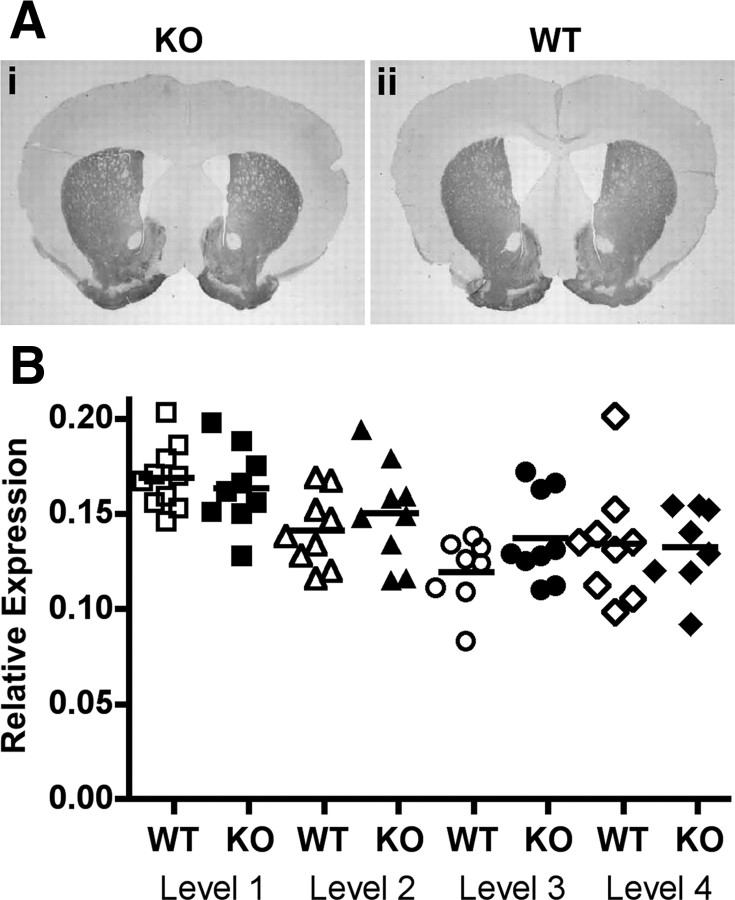
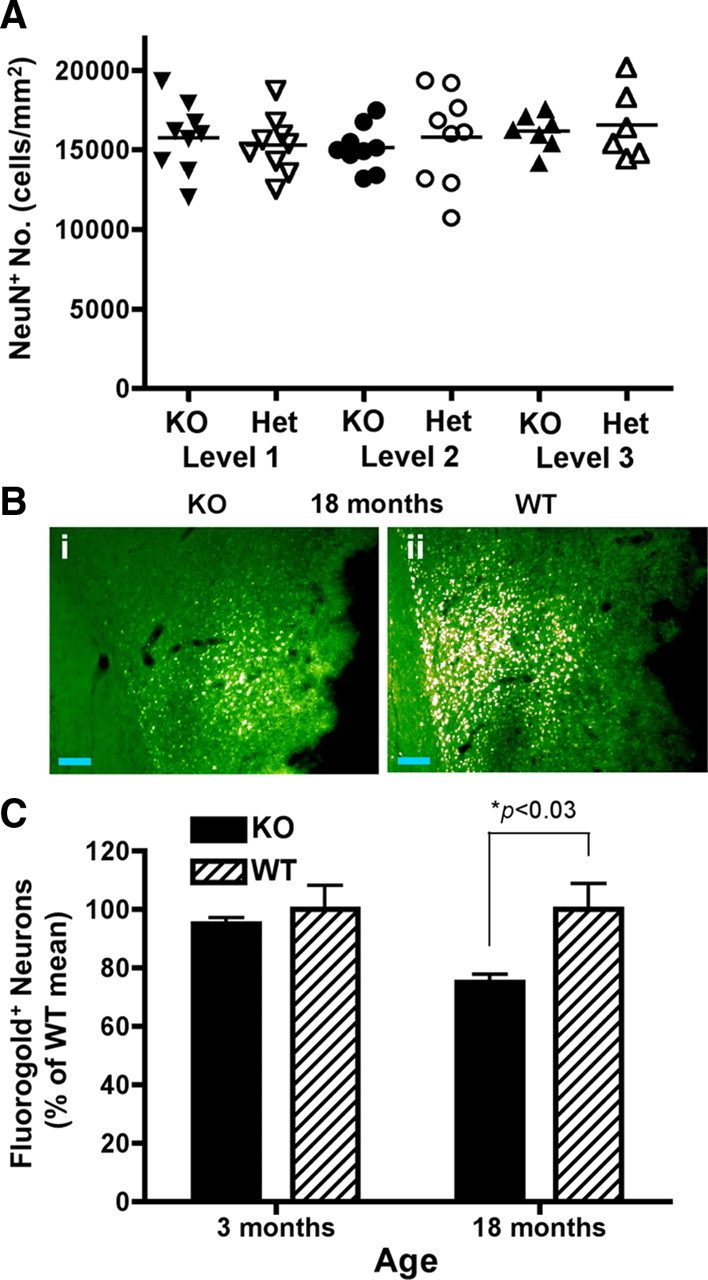
Death receptor 3 is a proinflammatory member of the immunomodulatory tumor necrosis factor receptor superfamily, which has been implicated in several inflammatory diseases such as arthritis and inflammatory bowel disease. Intriguingly however, constitutive DR3 expression has been detected in the brains of mice, rats, and humans, although its neurological function remains unknown. By mapping the normal brain expression pattern of DR3, we found that DR3 is expressed specifically by cells of the neuron lineage in a developmentally regulated and region-specific pattern. Behavioral studies on DR3-deficient (DR3(ko)) mice showed that constitutive neuronal DR3 expression was required for stable motor control function in the aging adult. DR3(ko) mice progressively developed behavioral defects characterized by altered gait, dyskinesia, and hyperactivity, which were associated with elevated dopamine and lower serotonin levels in the striatum. Importantly, retrograde tracing showed that absence of DR3 expression led to the loss of corticostriatal innervation without significant neuronal loss in aged DR3(ko) mice. These studies indicate that DR3 plays a key nonredundant role in the retention of normal motor control function during aging in mice and implicate DR3 in progressive neurological disease.
Conflict of interest statement
The authors declare no competing financial interests.
Figures
Similar articles
-
Death Receptor 3 (TNFRSF25) Increases Mineral Apposition by Osteoblasts and Region Specific New Bone Formation in the Axial Skeleton of Male DBA/1 Mice.J Immunol Res. 2015;2015:901679. doi: 10.1155/2015/901679. Epub 2015 May 3. J Immunol Res. 2015. PMID: 26065008 Free PMC article.
-
The death receptor 3/TL1A pathway is essential for efficient development of antiviral CD4⁺ and CD8⁺ T-cell immunity.FASEB J. 2012 Aug;26(8):3575-86. doi: 10.1096/fj.11-200618. Epub 2012 May 16. FASEB J. 2012. PMID: 22593543 Free PMC article.
-
Effect of early embryonic deletion of huntingtin from pyramidal neurons on the development and long-term survival of neurons in cerebral cortex and striatum.Neurobiol Dis. 2018 Mar;111:102-117. doi: 10.1016/j.nbd.2017.12.015. Epub 2017 Dec 21. Neurobiol Dis. 2018. PMID: 29274742 Free PMC article.
-
TL1A and DR3, a TNF family ligand-receptor pair that promotes lymphocyte costimulation, mucosal hyperplasia, and autoimmune inflammation.Immunol Rev. 2011 Nov;244(1):188-96. doi: 10.1111/j.1600-065X.2011.01068.x. Immunol Rev. 2011. PMID: 22017439 Free PMC article. Review.
-
The role of TL1A and DR3 in autoimmune and inflammatory diseases.Mediators Inflamm. 2013;2013:258164. doi: 10.1155/2013/258164. Epub 2013 Dec 21. Mediators Inflamm. 2013. PMID: 24453414 Free PMC article. Review.
Cited by
-
Regulation of early cartilage destruction in inflammatory arthritis by death receptor 3.Arthritis Rheumatol. 2014 Oct;66(10):2762-72. doi: 10.1002/art.38770. Arthritis Rheumatol. 2014. PMID: 25044706 Free PMC article.
-
Characterization of death receptor 3-dependent aortic changes during inflammatory arthritis.Pharmacol Res Perspect. 2016 Jun 10;4(4):e00240. doi: 10.1002/prp2.240. eCollection 2016 Aug. Pharmacol Res Perspect. 2016. PMID: 27347421 Free PMC article.
-
Progranulin-derived Atsttrin directly binds to TNFRSF25 (DR3) and inhibits TNF-like ligand 1A (TL1A) activity.PLoS One. 2014 Mar 20;9(3):e92743. doi: 10.1371/journal.pone.0092743. eCollection 2014. PLoS One. 2014. PMID: 24651300 Free PMC article.
-
Review: Novel Insights Into Tumor Necrosis Factor Receptor, Death Receptor 3, and Progranulin Pathways in Arthritis and Bone Remodeling.Arthritis Rheumatol. 2016 Dec;68(12):2845-2856. doi: 10.1002/art.39816. Arthritis Rheumatol. 2016. PMID: 27428882 Free PMC article. Review. No abstract available.
-
The role of tumor necrosis factor receptor superfamily members in mammalian brain development, function and homeostasis.Rev Neurosci. 2011;22(5):509-33. doi: 10.1515/RNS.2011.041. Epub 2011 Aug 24. Rev Neurosci. 2011. PMID: 21861782 Free PMC article. Review.
References
-
- Albin RL, Young AB, Penney JB. The functional anatomy of basal ganglia disorders. Trends Neurosci. 1989;12:366–375. - PubMed
Publication types
MeSH terms
Substances
Grants and funding
- G0300180/MRC_/Medical Research Council/United Kingdom
- G0901119(91900)/MRC_/Medical Research Council/United Kingdom
- G0300180(65735)/MRC_/Medical Research Council/United Kingdom
- C/05060/BB_/Biotechnology and Biological Sciences Research Council/United Kingdom
- G0500617(74644)/MRC_/Medical Research Council/United Kingdom
LinkOut - more resources
Full Text Sources
Other Literature Sources
Medical
Molecular Biology Databases
Research Materials