

A comparison of visual field sensitivity to photoreceptor thickness in retinitis pigmentosa
- PMID: 20220048
- PMCID: PMC2910646
- DOI: 10.1167/iovs.09-4945
A comparison of visual field sensitivity to photoreceptor thickness in retinitis pigmentosa
Abstract
Purpose: To explore the relationship between visual field sensitivity and photoreceptor layer thickness in patients with retinitis pigmentosa (RP).
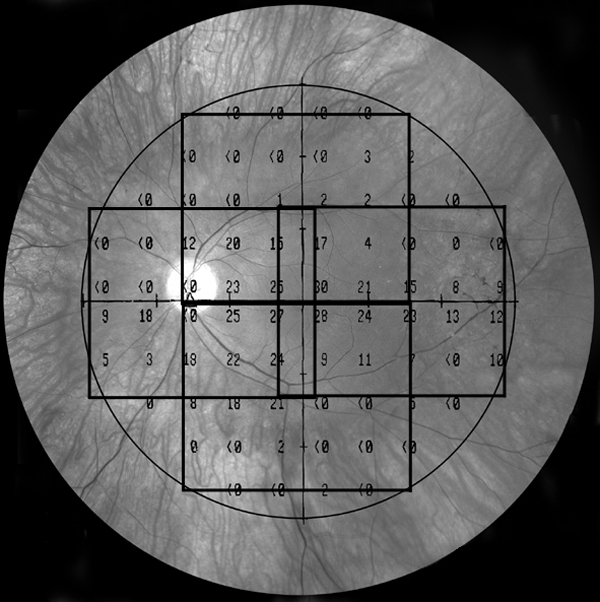
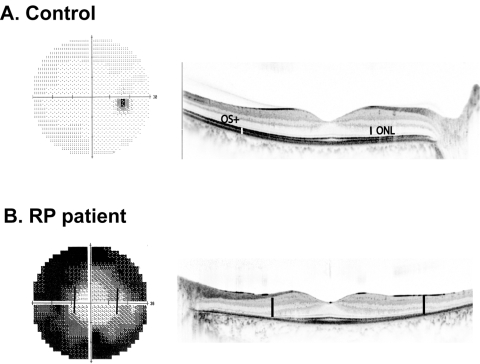
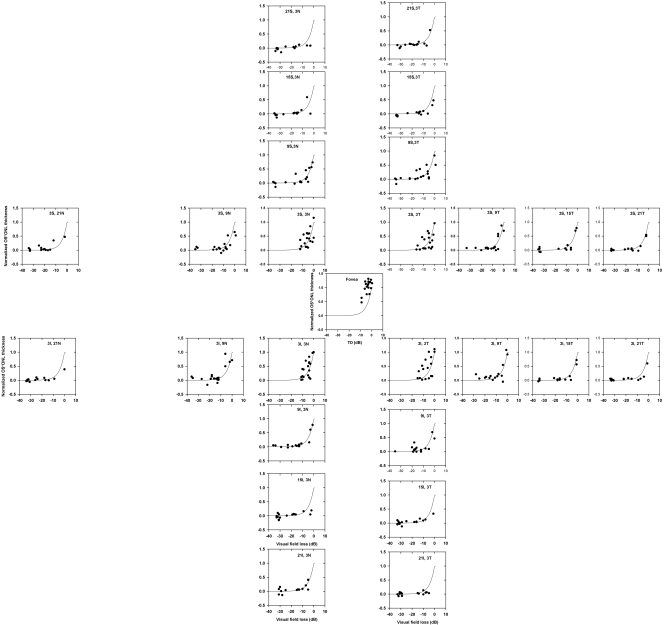
Methods: Static automated perimetry (central 30-2 threshold program with spot size III; Humphrey Field Analyzer; Carl Zeiss Meditec, Inc., Dublin, CA) and frequency domain optical coherence tomography (Fd-OCT) scans (Spectralis HRA+OCT; Heidelberg Engineering, Vista, CA) were obtained from 10 age-matched normal control subjects and 20 patients with RP who had retained good central vision (better than 20/32). The outer segment (OS+) thickness (the distance between retinal pigment epithelium [RPE])/Bruch's membrane [BM] to the photoreceptor inner-outer segment junction), outer nuclear layer (ONL), and total retinal thickness were measured at locations corresponding to visual field test loci up to 21 degrees eccentricity.
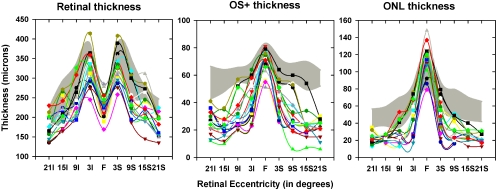
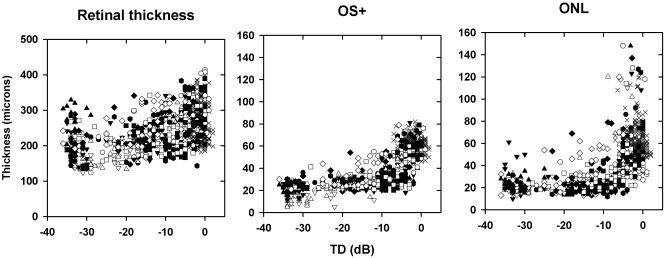
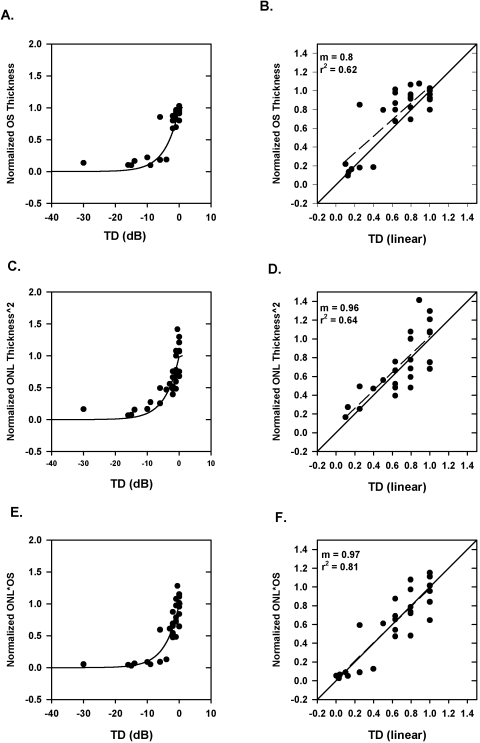
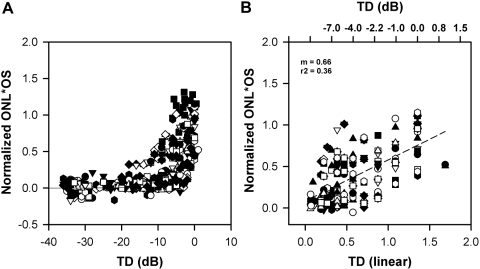
Results: The average OS+ thickness in the control eyes was 63.1 +/- 5.2 microm, varying from approximately 69 microm in the foveal center to 56 microm at 21 degrees eccentricity. In patients with RP, OS+ thickness was below normal limits outside the fovea, and thickness decreased with loss in local field sensitivity, reaching an asymptotic value of 21.5 microm at approximately -10 dB. The ONL thickness also decreased with local field sensitivity loss. Although relative OS thickness was linearly related to visual field loss at all locations examined, a slightly better correlation was found between the product of OS and ONL thickness and visual field loss.
Conclusions: In patients with RP with good foveal sensitivity, the OS thickness and the product of OS thickness and ONL thickness (assumed to represent the number of photoreceptors) decreases linearly with loss of local field sensitivity. In general, in regions where perimetric sensitivity loss is -10 dB or worse, the OS+ thickness approaches the thickness of the RPE/BM complex.
Figures
References
-
- Hartong DT, Berson eL, Dryja TP. Retinitis pigmentosa. Lancet 2006;368:1795–1809 - PubMed
-
- Heckenlively JR. Retinitis Pigmentosa Philadelphia: JB Lippincott Co.; 1986.
-
- Berson EL, Sandberg MA, Rosner B, Birch DG, Hanson AH. Natural course of retinitis pigmentosa over a three-year interval. Am J Ophthalmol 1985;99:240–251 - PubMed
-
- Birch DG, Anderson JL, Fish GE. Yearly rates of rod and cone functional loss in retinitis pigmentosa and cone-rod dystrophy. Ophthalmology 1999;106:258–268 - PubMed
-
- Massof RW, Dagnelie G. First order dynamics of visual field loss in retinitis pigmentosa. Clin Vision Sci 1990;5:1–26
Publication types
MeSH terms
Grants and funding
LinkOut - more resources
Full Text Sources
Research Materials
Miscellaneous
