. 2010 May;103(5):2532-43.
doi: 10.1152/jn.00506.2009. Epub 2010 Mar 10.

Dendritic HCN channels shape excitatory postsynaptic potentials at the inner hair cell afferent synapse in the mammalian cochlea

Affiliations

Dendritic HCN channels shape excitatory postsynaptic potentials at the inner hair cell afferent synapse in the mammalian cochlea

Eunyoung Yi et al. J Neurophysiol. 2010 May.

Abstract

Synaptic transmission at the inner hair cell (IHC) afferent synapse, the first synapse in the auditory pathway, is specialized for rapid and reliable signaling. Here we investigated the properties of a hyperpolarization-activated current (I(h)), expressed in the afferent dendrite of auditory nerve fibers, and its role in shaping postsynaptic activity. We used whole cell patch-clamp recordings from afferent dendrites directly where they contact the IHC in excised postnatal rat cochlear turns. Excitatory postsynaptic potentials (EPSPs) of variable amplitude (1-35 mV) were found with 10-90% rise times of about 1 ms and time constants of decay of about 5 ms at room temperature. Current-voltage relations recorded in afferent dendrites revealed I(h). The pharmacological profile and reversal potential (-45 mV) indicated that I(h) is mediated by hyperpolarization-activated cyclic nucleotide-gated cation (HCN) channels. The HCN channel subunits HCN1, HCN2, and HCN4 were found to be expressed in afferent dendrites using immunolabeling. Raising intracellular cAMP levels sped up the activation kinetics, increased the magnitude of I(h) and shifted the half activation voltage (V(half)) to more positive values (-104 +/- 3 to -91 +/- 2 mV). Blocking I(h) with 50 microM ZD7288 resulted in hyperpolarization of the resting membrane potential (approximately 4 mV) and slowing the decay of the EPSP by 47%, suggesting that I(h) is active at rest and shortens EPSPs, thereby potentially improving rapid and reliable signaling at this first synapse in the auditory pathway.


Figures

Fig. 1.
Fig. 1.
Current–voltage (I–V) relation recorded in an inner hair cell (IHC) afferent dendrite. Current responses to voltage steps in the absence (A) and the presence (B) of 1 μM tetrodotoxin (TTX). Voltage step protocol (inset in A): 200 ms voltage steps from −104 to −4 mV in 10 mV increments, from a holding potential of −84 mV. A: rapidly activating and inactivating sodium currents that sometimes escaped the voltage clamp (expanded trace shown in inset) were blocked by 1 μM TTX (B). C: current responses at 20 ms (solid circle) and 200 ms (open triangle) into the voltage steps after leak subtraction. A slowly activating inward current (i.e., a hyperpolarization-activated current [Ih]) was found at voltage steps to −94 mV or more negative potentials. Fast activating outward currents (within 5 ms) were activated at −64 mV and more positive voltages.
Fig. 2.
Fig. 2.
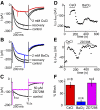
Ih currents in afferent dendrites are mediated by hyperpolarization-activated cyclic nucleotide-gated cation (HCN) channels. A–C: in afferent dendrite recordings, hyperpolarizing voltage steps from −84 to −124 mV were applied every 10 s for 0.5 s (in 1 μM TTX). Current responses consisted of an instantaneous inward current (Iinst) (most obvious in C) and a slowly developing inward current (I0.5). A–C: representative traces before, during, and after application of 2 mM CsCl, 2 mM BaCl2, or 50 μM ZD7288 (4-ethylphenylamino-1,2-dimethyl-6-methylaminopyrimidinium chloride). Fast inward deflections during the recordings in A to B represent excitatory postsynaptic currents (EPSCs). D and E: diary plots of the Ih amplitude during application of drugs. Ih amplitude was measured as I0.5Iinst. The effects of CsCl and BaCl2 were mostly reversible; the effect of ZD7288 was irreversible. F: percentage reduction in Ih amplitude during CsCl, BaCl2, and ZD7288 application. The Ih amplitudes were determined from mean values of 5 consecutive traces in each condition. To compensate for rundown of Ih, current amplitudes in 2 mM CsCl or 2 mM BaCl2 were compared with mean value of respective control and recovery. The Ih amplitude in 50 μM ZD7288 was compared with control.
Fig. 3.
Fig. 3.
Properties of Ih in afferent dendrites. A and B: Ih currents in response to voltage steps (every 10 s for 3 s, from a holding potential of −64 mV to voltages between −144 and −54 mV in 10 mV increments; see inset). External solution with: TTX (1–2 μM), 4-aminopyridine (4-AP, 2 mM), tetraethylammonium (TEA, 10–30 mM), and 6-cyano-7-nitroquinoxaline-2,3-dione (CNQX, 10 μM). A: in control solution. B: with 200 μM cyclic adenosine monophosphate (cAMP) intracellularly and additionally 200 μM 8-bromoadenosine-3′,5′ cyclic monophosphate (8-Br-cAMP) extracellularly. C: I–V relations in control (n = 3, black) and with cAMP analogs (n = 4, red). D: voltage dependence of Ih measured from tail currents. Tail current amplitudes were normalized and fit with a Boltzmann equation. Vhalf and slope factors were −104 ± 3 mV, 11 ± 1 in control (n = 3, black), and −91 ± 2 mV, 11 ± 1 in cAMP analogs (n = 4, red). E: activation kinetics of Ih currents. Current responses to voltage steps from −134 to −104 mV were fit with 2 exponentials, providing 2 time constants (τfast, τslow). Both time constants were significantly faster for currents recorded with cAMP analogs (n = 4, red) compared with control (n = 3, black). F: reversal potential of Ih. Conditioning voltages were applied for 3 s (to −124, −104, or −84 mV), followed by 10 ms voltage ramps (from −144 to −74 mV) (top traces: voltage commands; bottom traces: current responses to the commanding voltage ramps). The reversal potential was −45.5 mV for this recording.
Fig. 4.
Fig. 4.
HCN subunit expression pattern in the rat cochlea at P9. Three-dimensional reconstruction of confocal images from cochlear whole-mount preparations, apical turns. A: HCN1 labeling (green). B: HCN4 labeling (green). Vesicular glutamate transporter VGLUT3 (red) was used as a marker for IHCs. HCN1 and HCN4 labeling was found in the inner spiral plexus (isp) under the row of IHCs (ihc, arrowhead) as well as in the somata of spiral ganglion neurons (sgn). Scale bars: 50 μm.
Fig. 5.
Fig. 5.
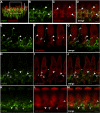
HCN subunits are localized in afferent dendrites. A: 3-dimensional reconstruction of calretinin and HCN1-labeled whole-mount rat organ of Corti preparation, apical turn at P9. HCN1 labeling (green) is concentrated in the basolateral region of the IHCs. Calretinin (red) labels IHCs (ihc) and afferent dendrites. B–D: close-up view showing single confocal laser-scanning micrographs. As seen in the merged view (D), HCN1 (B) and calretinin (C) immunolabeling overlap in some afferent dendrites (arrowheads). E–M: single confocal laser-scanning micrographs of whole-mount organs of Corti preparations, apical turns at P21. Preparations were colabeled for HCN1, HCN2, or HCN4 (green) and calretinin (red). Arrowheads indicate examples of double-labeled afferent dendrites. Note examples of ringlike HCN labeling surrounding calretinin labeling (open arrowheads). Some fibers were labeled for HCN but not for calretinin (asterisks). Scale bars: 5 μm.
Fig. 6.
Fig. 6.
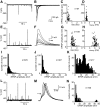
EPSCs and excitatory postsynaptic potentials (EPSPs) recorded at the IHC afferent synapse. A–K: whole cell recording from an afferent dendrite in the presence of 1 μM TTX showing EPSCs (A, B) (holding potential −94 mV) and EPSPs (E, F). B and F: overlaid representative traces of monophasic EPSCs and EPSPs on an expanded timescale. C, D, G, and H: 10–90% rise time (rise) or decay time constants (τdecay) plotted against the EPSC or EPSP amplitude. Rise and τdecay for EPSCs were 0.33 ± 0.14 and 1.24 ± 0.20 ms (324 EPSCs analyzed). Rise and τdecay for EPSPs were 0.96 ± 0.12 and 3.81 ± 0.36 ms (241 EPSPs analyzed). EPSP waveforms remained relatively invariable over the wide range of EPSP amplitudes. I–K: EPSP amplitude distributions (bin size 1 mV) from 3 afferent dendrite recordings. Median EPSP amplitudes were 2.3, 2.4, and 13.8 mV and resting membrane potentials were −75, −56, and −68 mV, respectively. The number of events analyzed is indicated in each panel. L–N: whole cell current-clamp recording in the absence of TTX. A mixture of EPSPs and spikes was observed. M: overlaid representative traces of spikes on an expanded timescale. Spike threshold (arrow) was −47 mV for this recording. N: amplitude distribution (bin size 1 mV). A wide gap in amplitude histogram distinguishes spikes from EPSPs.
Fig. 7.
Fig. 7.
Ih shortens EPSPs in afferent dendrites. A–H: whole cell current-clamp recording from afferent dendrites. Recordings were done in the presence of cAMP analogs (200 μM 8-Br-cAMP extracellularly and additionally 200 μM cAMP intracellularly). A–C: EPSP waveform before and while blocking Ih with 2 mM CsCl. A: average EPSP waveform before (black) and during application of 2 mM CsCl (red). B: EPSP decay time constants (τdecay) plotted against EPSP amplitudes before and while blocking Ih with 2 mM CsCl; control: τdecay = 4.97 ms (black, 34 EPSPs); in 2 mM CsCl: τdecay = 7.18 ms (red, 41 EPSPs). C: summarized results from 7 recordings. D–F: EPSP waveform before and during application of 50 μM ZD7288. D: average EPSP waveform before (black) and during application of 50 μM ZD7288 (magenta). E: EPSP decay time constants (τdecay) plotted against EPSP amplitudes; control: τdecay = 5.38 ms (black, 22 EPSPs), in 50 μM ZD7288: τdecay = 8.30 ms (magenta, 16 EPSPs). F: summarized results from 6 recordings.

Similar articles

Cited by

References

    1. Bakondi G, Por A, Kovacs I, Szucs G, Rusznak Z. Hyperpolarization-activated, cyclic nucleotide-gated, cation non-selective channel subunit expression pattern of guinea-pig spiral ganglion cells. Neuroscience 158: 1469–1477, 2009. - PubMed
    1. Bal R, Oertel D. Hyperpolarization-activated, mixed-cation current (Ih) in octopus cells of the mammalian cochlear nucleus. J Neurophysiol 84: 806–817, 2000. - PubMed
    1. Bal R, Oertel D. Potassium currents in octopus cells of the mammalian cochlear nucleus. J Neurophysiol 86: 2299–2311, 2001. - PubMed
    1. Banks MI, Pearce RA, Smith PH. Hyperpolarization-activated cation current (Ih) in neurons of the medial nucleus of the trapezoid body: voltage-clamp analysis and enhancement by norepinephrine and cAMP suggest a modulatory mechanism in the auditory brain stem. J Neurophysiol 70: 1420–1432, 1993. - PubMed
    1. Banks MI, Smith PH. Intracellular recordings from neurobiotin-labeled cells in brain slices of the rat medial nucleus of the trapezoid body. J Neurosci 12: 2819–2837, 1992. - PMC - PubMed

Publication types

MeSH terms

LinkOut - more resources