

Spectral tuning in photoactive yellow protein by modulation of the shape of the excited state energy surface
- PMID: 20220103
- PMCID: PMC2851917
- DOI: 10.1073/pnas.0903092107
Spectral tuning in photoactive yellow protein by modulation of the shape of the excited state energy surface
Abstract
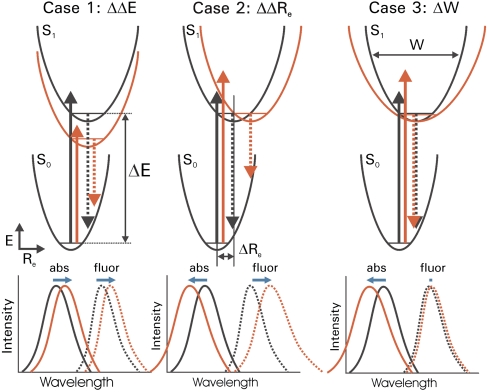
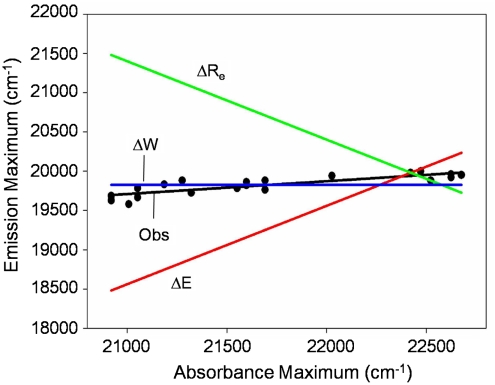
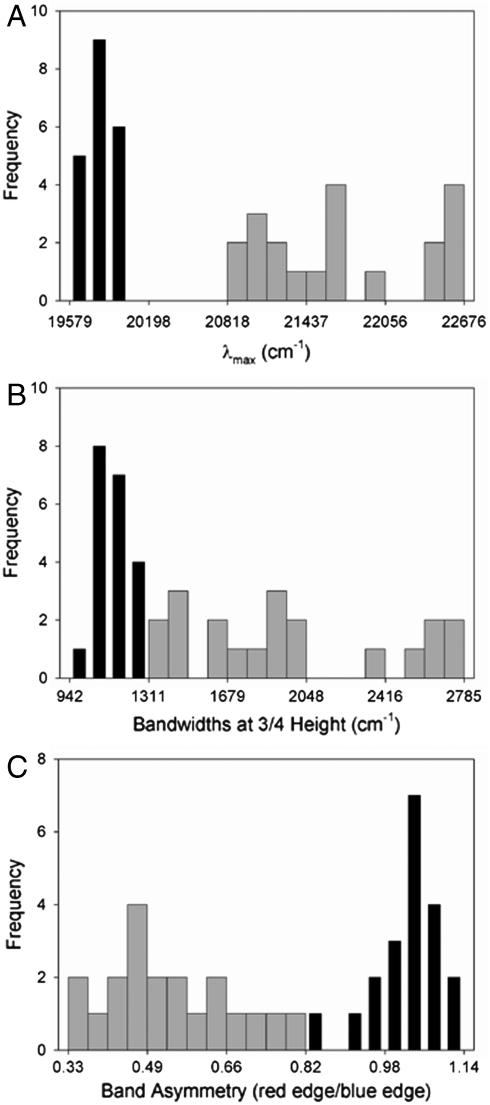
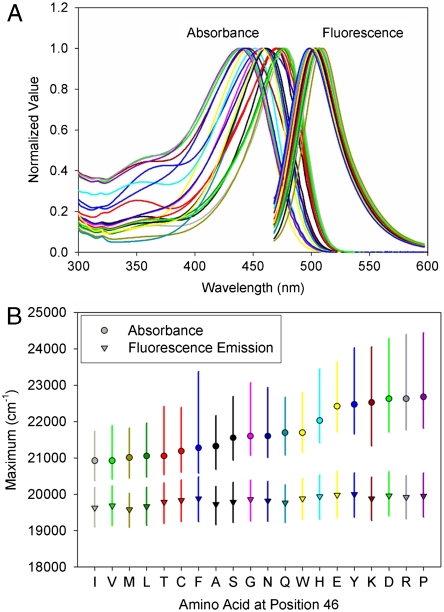
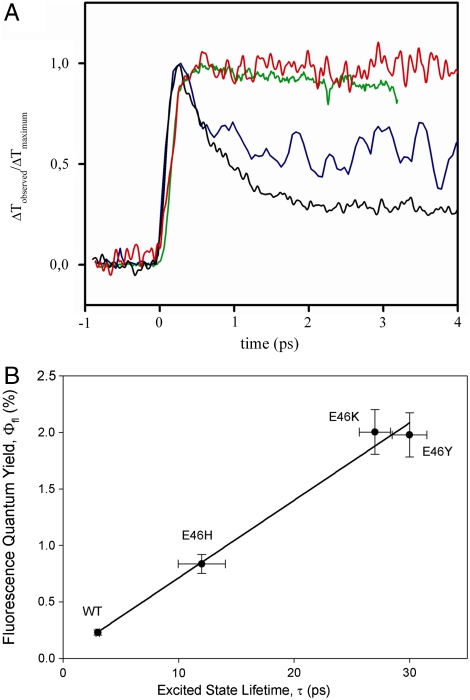
Protein-chromophore interactions in photoreceptors often shift the chromophore absorbance maximum to a biologically relevant spectral region. A fundamental question regarding such spectral tuning effects is how the electronic ground state S(0) and excited state S(1) are modified by the protein. It is widely assumed that changes in energy gap between S(0) and S(1) are the main factor in biological spectral tuning. We report a generally applicable approach to determine if a specific residue modulates the energy gap, or if it alters the equilibrium nuclear geometry or width of the energy surfaces. This approach uses the effects that changes in these three parameters have on the absorbance and fluorescence emission spectra of mutants. We apply this strategy to a set of mutants of photoactive yellow protein (PYP) containing all 20 side chains at active site residue 46. While the mutants exhibit significant variation in both the position and width of their absorbance spectra, the fluorescence emission spectra are largely unchanged. This provides strong evidence against a major role for changes in energy gap in the spectral tuning of these mutants and reveals a change in the width of the S(1) energy surface. We determined the excited state lifetime of selected mutants and the observed correlation between the fluorescence quantum yield and lifetime shows that the fluorescence spectra are representative of the energy surfaces of the mutants. These results reveal that residue 46 tunes the absorbance spectrum of PYP largely by modulating the width of the S(1) energy surface.
Conflict of interest statement
The authors declare no conflict of interest.
Figures
Similar articles
-
Spectral tuning of photoactive yellow protein.Photochem Photobiol. 2007 Mar-Apr;83(2):323-7. doi: 10.1562/2006-06-16-RA-930. Photochem Photobiol. 2007. PMID: 17017845
-
Time-resolved single tryptophan fluorescence in photoactive yellow protein monitors changes in the chromophore structure during the photocycle via energy transfer.Biochemistry. 2005 Dec 27;44(51):16804-16. doi: 10.1021/bi051448l. Biochemistry. 2005. PMID: 16363794
-
Proline 68 enhances photoisomerization yield in photoactive yellow protein.J Phys Chem B. 2011 May 26;115(20):6668-77. doi: 10.1021/jp112113s. Epub 2011 May 4. J Phys Chem B. 2011. PMID: 21542640
-
The growing family of photoactive yellow proteins and their presumed functional roles.Photochem Photobiol Sci. 2012 Oct;11(10):1495-514. doi: 10.1039/c2pp25090j. Photochem Photobiol Sci. 2012. PMID: 22911088 Review.
-
Small Molecule-Photoactive Yellow Protein Labeling Technology in Live Cell Imaging.Molecules. 2016 Aug 31;21(9):1163. doi: 10.3390/molecules21091163. Molecules. 2016. PMID: 27589715 Free PMC article. Review.
Cited by
-
Strong ionic hydrogen bonding causes a spectral isotope effect in photoactive yellow protein.Biophys J. 2013 Dec 3;105(11):2577-85. doi: 10.1016/j.bpj.2013.10.017. Biophys J. 2013. PMID: 24314088 Free PMC article.
-
Electronic Absorption Spectra from MM and ab initio QM/MM Molecular Dynamics: Environmental Effects on the Absorption Spectrum of Photoactive Yellow Protein.J Chem Theory Comput. 2012 Dec 1;8(12):5092-5106. doi: 10.1021/ct3006826. Epub 2012 Oct 6. J Chem Theory Comput. 2012. PMID: 23476156 Free PMC article.
-
On the involvement of single-bond rotation in the primary photochemistry of photoactive yellow protein.Biophys J. 2011 Sep 7;101(5):1184-92. doi: 10.1016/j.bpj.2011.06.065. Biophys J. 2011. PMID: 21889456 Free PMC article.
-
Mapping solvation dynamics at the function site of flavodoxin in three redox states.J Am Chem Soc. 2010 Sep 15;132(36):12741-7. doi: 10.1021/ja1050154. J Am Chem Soc. 2010. PMID: 20731381 Free PMC article.
-
Dynamics and mechanisms of DNA repair by photolyase.Phys Chem Chem Phys. 2015 May 14;17(18):11933-49. doi: 10.1039/c4cp05286b. Phys Chem Chem Phys. 2015. PMID: 25870862 Free PMC article. Review.
References
-
- Scheer H. The pigments. In: Green BR, Parson WW, editors. Advances in Photosynthesis and Respiration. Vol 13. Dordrecht, The Netherlands: Kluwer; 2003. pp. 29–81.
-
- Honig B, et al. External point-charge model for wavelength regulation in visual pigments. J Am Chem Soc. 1979;101:7084–7086.
-
- Kochendoerfer GG, Lin SW, Sakmar TP, Mathies RA. How color visual pigments are tuned. Trends Biochem Sci. 1999;24:300–305. - PubMed
-
- Nakanishi K, Baloghnair V, Arnaboldi M, Tsujimoto K, Honig B. An external point-charge model for bacteriorhodopsin to account for its purple color. J Am Chem Soc. 1980;102:7945–7947.
-
- Yan B, et al. Spectral tuning in bacteriorhodopsin in the absence of counterion and coplanarization effects. J Biol Chem. 1995;270:29668–29670. - PubMed
Publication types
MeSH terms
Substances
Grants and funding
LinkOut - more resources
Full Text Sources
Other Literature Sources
Miscellaneous
