. 2010 May 13;115(19):3930-8.
doi: 10.1182/blood-2009-08-240077. Epub 2010 Mar 10.

Transactivation of the dopamine receptor 3 gene by a single provirus integration results in development of B-cell lymphoma in transgenic mice generated from retrovirally transduced embryonic stem cells

Affiliations

Transactivation of the dopamine receptor 3 gene by a single provirus integration results in development of B-cell lymphoma in transgenic mice generated from retrovirally transduced embryonic stem cells

Yumi Hirata et al. Blood. .

Abstract

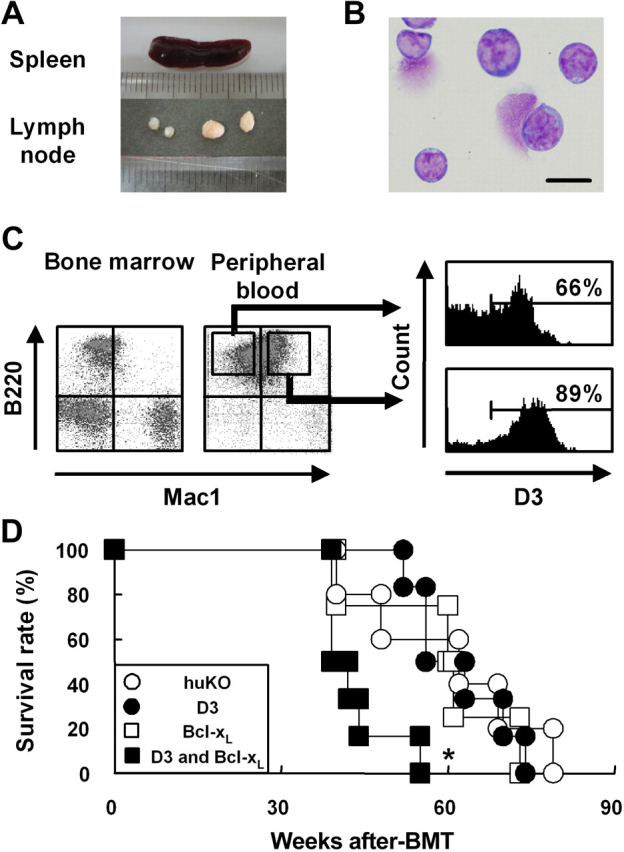
Gene transfer vectors based on retroviruses are commonly used in gene therapy applications because of their unique ability to integrate efficiently into host genomes. This ability also forms the basis of a transformation event that can be induced in transduced cells by transactivation of proto-oncogenes near the vector integration sites. Here, we report on the development of lymphoma in mice generated from embryonic stem cells transduced with an enhanced green fluorescent protein. The cells expressed B220, CD5, Mac1, and IgM on their surfaces and expressed transcription factors characteristic of B-cell lymphoma. Importantly, each mouse had a single copy of the provirus in its genome; the copy was integrated into the second intron of the dopamine receptor 3 (D3) gene, and high-level expression of D3 was detected only in the lymphoma cells. Ectopic expression of D3 in murine marrow cells resulted in preferential proliferation of cells at the pre-B-cell stage in response to a D3-specific agonist, but this proliferation was not observed in vivo. Cells cotransduced with D3 and Bcl-x(L) genes had a phenotype similar to that of lymphoma in vivo, suggesting that the leukemogenesis induced by retroviral integration required "second hit" mutations of additional genes.


Figures

Figure 1
Figure 1
Hematologic analysis of the transgenic mice affected with B lymphoma. (A) EGFP expression in peripheral blood of a transgenic mouse affected with typical hematologic abnormalities at the indicated ages. (B) Spleens of 20-month-old wild-type and transgenic mice. (C-D) Morphologic appearance of spleen and peripheral blood cells (May-Gruenwald-Giemsa staining 63×/1.4 NA oil objective; C) and flow cytometric analysis of bone marrow and spleen cells (D) of transgenic mice exhibiting remarkable expansion of EGFP+ cells. Bars represent 10 μm in panel C.
Figure 2
Figure 2
Characteristics of B-lymphoma cells generated from the transgenic mice. (A) PCR analysis of immunoglobulin gene rearrangement in splenic B cells of wild-type mice and B-lymphoma cells of transgenic mice. Lane 1 shows J558-JH4; lane 2, 7183-JH4; lane 3, Q52-JH4; lane 4, D-JH4; and lane 5, distilled water. (B) Morphologic appearance of B-lymphoma cells in vitro (left panel shows bright field in culture; right panel, May-Gruenwald-Giemsa staining of a cytospun sample; 63×/1.4 NA oil objective). Bars represent 10 μm. (C-D) Electrophoresis of genomic DNA (C) and propidium iodide staining (D) of untransduced or Bcl-xL–transduced B-lymphoma cells. (E) Flow cytometric analysis of marrow, spleen, and lymph node cells in NOD/SCID mice that underwent transplantation with B-lymphoma cells at 4 weeks after transplantation. (F) Karyotype analysis of the B-lymphoma cells by Giemsa staining (100×/1.4 NA oil objective). (G) The number of chromosomes of B-lymphoma cells. MW indicates molecular weight marker in panels A and C.
Figure 3
Figure 3
Identification of retroviral integration sites. (Top) A scheme of an integration site of the provirus into D3 locus determined on the basis of the results of LAM-PCR analysis. BamHI sites and probes used in Southern blotting are also shown. (Bottom) Southern blotting of BamHI-digested genomic DNA obtained from F1 (lanes 1 and 3) and F2 (lanes 2 and 4) of transgenic mice using an EGFP (lanes 1-2) or D3 (lanes 3-4) probe.
Figure 4
Figure 4
Activation of the D3 gene in the transgenic mice. (A) RT-PCR analysis of D3 expression in brain and splenic B cells of wild-type mice, and B-lymphoma cells of transgenic mice. β-actin is used as an internal control. MW indicates molecular weight marker. (B) Northern blotting of total RNA obtained from brain or B-lymphoma cells using a D3 probe. Left panel is shown as a loading control. D3 transcripts are found at the size of 8.3 kb in the right panel. 28S and 18S indicate ribosomal RNA. (C) Quantitative RT-PCR analysis of D3 expression in normal splenic B cells and B-lymphoma cells. (D) Quantitative RT-PCR analysis of D3 expression in B-lymphoma cells (CD5 or CD5+ in EGFP+ population) and normal B cells (EGFP or EGFP+) in transgenic mice. Error bars are ± SD. *P < .05; **P < .01; ***P < .005 in panels C and D.
Figure 5
Figure 5
A role of D3 expression in B-cell development. (A) Coculture experiments of D3-transduced KL cells on PA6 cells in the presence of DPAT. The number of HPCs, pro-B, pre-B, and myeloid cells yielded from huKO- or D3-transduced KL cells (□ or ■, respectively) were shown. Representative data are shown in 2 independent experiments. (B) HPCs, pro-B, and pre-B cells derived from the transduced huKO-transduced (□) or D3-tranduced KL cells (■) cultured on PA6 cells were isolated and their proliferations were determined by the proliferation assay using [3H]-thymidine in the presence or absence of DPAT (Ago + or −, respectively). Data are shown as normalized values to DPAT-free, huKO-transduced cultures in each cell population. Representative data are shown in 2 independent experiments. Error bars are ± SD. *P < .05.
Figure 6
Figure 6
Hematologic abnormality in mice that received transplants of KL cells genetically modified to express D3 and Bcl-xL. (A) RT-PCR analysis of D3 and Bcl-xL expression in peripheral blood cells from mice that underwent transplantation with D3-transduced or D3- and Bcl-xL–transduced KL cells. Left and right panels show D3 and Bcl-xL expression, respectively. β-actin is used as an internal control. D3 mice indicates mice that received transplants of D3-transduced KL cells; D3/Bcl-xL mice, mice that received transplants of D3- and Bcl-xL–transduced KL cells; and MW, molecular weight marker. A vertical line has been inserted to indicate repositioned gel lanes of β-actin and Bcl-XL. (B-C) A total of 5 mice received transplants of KL cells transduced with both D3 and Bcl-xL. The percentages of leukocytes expressing Mac1 (B) and the total number of leukocytes (C) in the peripheral blood are shown. Each open or filled symbol represents a mouse with or without hematologic abnormality, respectively.
Figure 7
Figure 7
Analysis of mice affected with B lymphoma after transplantation with D3- and Bcl-xL–transduced KL cells. (A-B) Morphologic appearance of spleen, lymph nodes (A), and peripheral blood cells (May-Gruenwald-Giemsa staining; B) in mice that received transplants of D3- and Bcl-xL–transduced KL cells at 40 weeks after transplantation (63×/1.4 NA oil objective). Bar in panel B represents 10 mm. (C) Flow cytometric analysis of marrow or peripheral blood cells (left and middle panels, respectively). D3 expression in Mac1 or Mac1+ cells in B220+ population was further analyzed (right panel). (D) Survival analysis of mice that underwent transplantation with huKO-transduced (○), D3-transduced (●), Bcl-xL–transduced (□), or D3- and Bcl-xL–transduced KL cells (■). BMT indicates BM transplantation. *P < .01 compared with the other groups.

Similar articles

References

    1. Aiuti A, Cattaneo F, Galimberti S, et al. Gene therapy for immunodeficiency due to adenosine deaminase deficiency. N Engl J Med. 2009;360(5):447–458. - PubMed
    1. Hacein-Bey-Abina S, Le Deist F, Carlier F, et al. Sustained correction of X-linked severe combined immunodeficiency by ex vivo gene therapy. N Engl J Med. 2002;346(16):1185–1193. - PubMed
    1. Ott MG, Schmidt M, Schwarzwaelder K, et al. Correction of X-linked chronic granulomatous disease by gene therapy, augmented by insertional activation of MDS1-EVI1, PRDM16 or SETBP1. Nat Med. 2006;12(4):401–409. - PubMed
    1. Cartier N, Hacein-Bey-Abina S, Bartholomae CC, et al. Hematopoietic stem cell gene therapy with a lentiviral vector in X-linked adrenoleukodystrophy. Science. 2009;326(5954):818–823. - PubMed
    1. Baum C, Düllmann J, Li Z, et al. Side effects of retroviral gene transfer into hematopoietic stem cells. Blood. 2003;101(6):2099–2113. - PubMed

Publication types

MeSH terms