. 2010 May 7;285(19):14585-93.
doi: 10.1074/jbc.M109.094334. Epub 2010 Mar 10.

A novel Wilms tumor 1 (WT1) target gene negatively regulates the WNT signaling pathway

Affiliations

A novel Wilms tumor 1 (WT1) target gene negatively regulates the WNT signaling pathway

Myoung Shin Kim et al. J Biol Chem. .

Abstract

Mammalian kidney development requires the functions of the Wilms tumor gene WT1 and the WNT/beta-catenin signaling pathway. Recent studies have shown that WT1 negatively regulates WNT/beta-catenin signaling, but the molecular mechanisms by which WT1 inhibits WNT/beta-catenin signaling are not completely understood. In this study, we identified a gene, CXXC5, which we have renamed WID (WT1-induced Inhibitor of Dishevelled), as a novel WT1 transcriptional target that negatively regulates WNT/beta-catenin signaling. WT1 activates WID transcription through the upstream enhancer region. In the developing kidney, Wid and Wt1 are coexpressed in podocytes of maturing nephrons. Structure-function analysis demonstrated that WID interacts with Dishevelled via its C-terminal CXXC zinc finger and Dishevelled binding domains and potently inhibits WNT/beta-catenin signaling in vitro and in vivo. WID is evolutionarily conserved, and ablation of wid in zebrafish embryos with antisense morpholino oligonucleotides perturbs embryonic kidney development. Taken together, our results demonstrate that the WT1 negatively regulates WNT/beta-catenin pathway via its target gene WID and further suggest a role for WID in nephrogenesis.


Figures

FIGURE 1.
FIGURE 1.
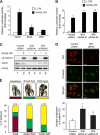
WID is a WT1(−KTS) target gene. A, quantitative reverse transcription-PCR analysis of WID. WID transcript level was measured by quantitative reverse transcription-PCR at indicated times after removal of tet in UB27 and UD29 cells. Data are the means ± S.D. of three independent experiments. B, Western blot analysis. Total cell lysates were prepared from UB27 cells (− or + tet) and immunoblotted with α-WT1, α-WID, and α-actin antibodies. C, ChIP analysis. UB27 cells were induced to express WT1(−KTS), and the cross-linked chromatin was immunoprecipitated with α-WT1 or rabbit IgG antibodies, followed by PCR amplification with primers corresponding to the WID enhancer regions E1–E3 (black boxes) or to the adjacent regions N1 and N2 (gray boxes) located ∼10 kb upstream of the transcriptional start (+1). Distance between regions is as follows: E1–E2 (420 bp), E2–N1 (1540 bp), N1–E3 (2170 bp), and E3–N2 (1610 bp). Quantitative PCR analysis of ChIP was performed independently using SYBR Green, and the result is presented as the fold increase over IgG (lower panel). D, luciferase (LUC) reporter assay for WID enhancer regions. NIH3T3 cells were cotransfected with plasmids containing the E1, E2, or E3 regions in either sense (SE) or antisense (AS) orientations and with either pcDNA3-WT1(−KTS) or empty vector and Renilla luciferase. Data represent the mean ± S.D. from three independent experiments.
FIGURE 2.
FIGURE 2.
WID inhibits the WNT/β-catenin signaling. A, TOPFlash luciferase reporter assay. Super8XTOPFlash plasmid was transfected into HEK293 cells either with pCMV-WID, IDAX, or empty vector. Luciferase activity was measured following treatment with control L (white bar) or Wnt3a CM (black bar) for 6 h. B, luciferase reporter assay after siRNA knockdown of Wid. Super8XTOPFlash plasmid was transfected into mouse L cells either with scrambled (control) or Wid siRNAs, and luciferase activities were measured. Data represent the mean ± S.D. from three independent experiments. Student's t test. *, p value = 0.017; **, p value = 0.019. C, stabilization of β-catenin after Wid depletion. L cells were transfected with either scrambled (control) or Wid siRNAs, treated with L (−) or Wnt3a CM for 1 h, and total cell lysates were immunoblotted with antibodies against β-catenin, WID, and actin. D, nuclear localization of β-catenin after Wid depletion. L cells grown on chambered coverglass were transfected with control or Wid siRNAs and treated with Wnt3a CM as in C. Fixed cells were double-immunostained with antibodies against WID and β-catenin. Images were captured under an oil immersion objective. Scale bar, 20 μm. Lower panel, percentage of nuclear β-catenin from 3 to 4 randomly chosen fields was calculated from three independent experiments. Data represent the mean ± S.D. Student's t test. *, p value = 0.008; **, p value = 0.016. E, inhibition of WNT signaling by WID in zebrafish. Plasmids containing zebrafish wnt8a alone or together with either WID or IDAX were injected into 1-cell zebrafish embryos and scored for the headless, small eye, or wild type phenotypes. Representative phenotypes of zebrafish embryos are shown.
FIGURE 3.
FIGURE 3.
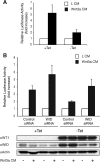
WT1 inhibits the WNT/β-catenin signaling. A, luciferase reporter assay. Super8XTOPFlash and Renilla luciferase plasmids were cotransfected into UB27 cells, and luciferase activity was measured with (−tet) or without (+tet) WT1 expression. B, siRNA knockdown of WID. Super8XTOPFlash and Renilla luciferase plasmids were transfected into UB27 cells with either scrambled (control) or WID siRNA, and WT1 expression was induced (−tet) or uninduced (+tet), and luciferase activity was measured. Data represent the mean ± S.D. from three independent experiments. Cell lysates were immunoblotted with antibodies against WT1, WID, and actin.
FIGURE 4.
FIGURE 4.
WID interacts with DVL. A, interaction of WID and Dvl2. HEK293 cell lysate transfected with WID, FLAG-Dvl2, and AXIN1 was immunoprecipitated (IP) with α-WID or α-FLAG antibody and immunoblotted (IB) with α-FLAG, α-AXIN, or α-WID antibodies. B, interaction of endogenous WID and DVL2. HEK293 cell lysate was immunoprecipitated with α-WID antibody and immunoblotted with α-Dvl2 antibody. C, in vitro binding assay. In vitro synthesized 35S-labeled WID (wild type or deletion mutants) was incubated with 35S-labeled Myc-DVL3, immunoprecipitated with α-Myc antibody, and analyzed by SDS-PAGE and autoradiography. D, DBD and the CXXC are essential domains. HEK293 cells were cotransfected with Super8XTOPFlash plasmid and either with wild type WID or WID deletion mutants, and luciferase activity was measured after control or Wnt3a CM treatment. Data represent the mean ± S.D. from three independent experiments. E, Western blot analysis. HEK293 cells were transfected with wild type FLAG-WID or WID deletion mutants, and cell lysates were analyzed by immunoblotting with α-FLAG and α-actin (loading control) antibody. Because of the lower expression of wild type WID, more cell lysates from the empty vector or wild type WID-transfected cells were loaded.
FIGURE 5.
FIGURE 5.
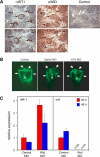
Depletion of zebrafish wid results in defective kidney development. A, colocalization of Wt1 and Wid in podocytes of developing kidney. Serial sections of mouse embryonic kidney at 14.5 days post-coitum were immunostained with α-WT1 or α-WID antibodies. Arrows indicate pre-podocytes of S-shaped bodies and podocytes of maturing glomeruli, which are positive for both Wt1 and Wid. White arrowheads indicate Wt1-negative tubules that express Wid. Scale bars, 100 μm. B, representative images of the pronephros of wt1b::GFP transgenic zebrafish embryos injected with either the splice (Splice MO) or the start codon (ATG MO) wid antisense morpholino oligonucleotides are shown. Cystic glomeruli are clearly visible in the wid morpholino-injected animals but not in the control. Arrowheads indicate glomeruli, and arrows indicate pronephric tubules, and asterisks indicate exocrine pancreas. C, quantitative reverse transcription-PCR analysis of wid and dkk-1. Total RNAs were collected from 10 pooled control morpholino or wid morpholino-injected embryos at the indicated stage. For comparison, expression in 30-h-old control embryos was set to 1. Data are the mean ± S.D. of three independent experiments.

Similar articles

Cited by

References

    1. Rivera M. N., Haber D. A. (2005) Nat. Rev. Cancer 5, 699–712 - PubMed
    1. Schedl A. (2007) Nat. Rev. Genet. 8, 791–802 - PubMed
    1. Hohenstein P., Hastie N. D. (2006) Hum. Mol. Genet. 15, R196–R201 - PubMed
    1. Lee S. B., Haber D. A. (2001) Exp. Cell Res. 264, 74–99 - PubMed
    1. Fukuzawa R., Heathcott R. W., More H. E., Reeve A. E. (2007) J. Clin. Pathol. 60, 1013–1016 - PMC - PubMed

Publication types

MeSH terms